sponsored links


Showing posts with label temperatures. Show all posts

Tuesday, September 15, 2009

World Celebrities Sing To Stop Global Warming

GENEVA — (AFP) — British rock group Duran Duran and heavy metal band Scorpions are among 55 world celebrities who have joined in recording a song to draw attention to the global warming crisis, organisers said on Monday.


The song is part of a mass media campaign on the threats of climate change organised by the Geneva-based Global Humanitarian Forum, headed by former UN secretary general Kofi Annan. The song entitled “Beds’r Burning”, which was originally recorded by the Australian group Midnight Oil in the 1980s, can be downloaded from the Internet for free and will be presented to the public at a launch in Paris on October 1.


“If we do not stop the (greenhouse gas) emissions today, global warming will be still be with us in 40 to 50 years,” warned Walter Fust, director of the Forum, at a press conference in Geneva. The media campaign featuring the song is aimed at putting pressure on world leaders to reach an agreement on tackling climate change at a UN-sponsored conference in Copenhagen in December.


Some of the other popular artists who add their voices to the anti-global warming song include French ‘Piaf’ actress Marion Cotillard, Senegalese star Youssou N’dour, Irish singer/composer Bob Geldorf, Chinese singer Khalil Fong, and even a Nobel peace laureate, South African archbishop Desmond Tutu.


B.S. Report–I got no problem with them singing to stop global warming. Go ahead–sing your heads off. Unfortunately, they’re not content to merely sing about the perils of global warming–they actually want to do something about it. That’s where we have serious issues with these maniacs.

I believe that singing has the same likelihood of stopping global warming than any of the other remedies being proposed–particularly that “Cap and Tax” monstrosity that already passed in the U.S. House in late June. At what point will the present temperatures convince people that perhaps the global warming scenario is all wet? After all, many areas around the world are experiencing their coolest temperatures in many decades.

The global warming bus has left the station and unless Florida starts to develop an ice sheet it’s going to be difficult to stop this radical push to combat what may be a mythical problem. Global warming is as much a political movement as it is a scientific movement. I don’t doubt that there are many scientists that believe it’s occurring but an ever-growing amount of scientists are becoming quite skeptical of the data.

In any event it’s the amount of “man-made” warming that’s important because if very little of the warming is occurring because of our activities than what’s the benefit of completely altering our lifestyles? Are we really willing to further destroy our economy because we may someday be able to lower temperature by 1/2 a degree? It sure seems ridiculous, doesn’t it?

----------------------------------------------------------------------------------------------------------------------------------

Recent Post:

Cause of Global Warming: From Mining Coal to Raising Cattle

Why It Is Important To Know The Main Cause Of Global Warming

Why Cutting Carbon Emissions is not Enough

The American Pika Is Losing The Battle With Global Warming

Is global warming a cyclical event?

Mass migration likely to result from global warming

Monday, September 14, 2009

The American Pika Is Losing The Battle With Global Warming


No, not Pikachu. The American Pika is a little animal with a big problem. These cute, hamster-sized mammals live in the Rockies where they rely on the snow and high altitude to stay cool.

And keeping cool is super important – just a few hours of exposure to 78 degree temps can kill a Pika!

But rising temperatures from global warming are forcing the Pika to seek refuge at higher and higher altitudes in order to stay cool in the summer months.

Soon, there will be nowhere left for them to climb...

Will you urge the Senate to move quickly on a crucial bill to fight global warming this week, as they return to Washington?

There's no time to delay! Send your letter demanding urgent action on global warming today.

The Pika is about to become the first mammal in the continental U.S. to be added to the Endangered Species list because of global warming.

As soon as this month, the Senate will consider a once-in-a-lifetime bill to fight global warming. But if they fail to pass it quickly, it could mean the end for the Pika and other threatened species like Polar Bears and Monarch Butterflies.

The Senate is back from recess and on Capitol Hill – now is the time to shape their priorities.

Write your senators now to make sure that passing a strong climate bill is their top priority right out of the starting gate.

Once you've sent your message, please spread the word to your friends and family and ask them to join you in protecting the Pika and the Polar Bear.

Global warming is here. If we don't act now, it won't be long before animals like the Pika are history.

Has the Solar Minimum Counteracted Man-Made Warming?

The sun

Decreasing solar irradiance between 2002 and 2008 has countered most of the anthropogenic (man-made) warming of the earth's surface, according to new research that was published in the Geophysical Research Letters.


Two researchers, Judith Lean (NRL) and David Rind (NASA/GISS) looked at four drivers of climate change and showed graphs of how much each has contributed to the changing temperature of the earth's surface since 1980.


The four drivers.........


1. Volcanic aerosols- cooling influence
2. El Nino- warming influence
3. Greenhouse gases- warming influence
4. Solar cycle- variable influence.


You can check out the graphs right here, courtesy of Spaceweather.com. The article is about halfway down the page.


Lean and Rind also offered a future prediction of temperatures in the abstract.......


From 2009 to 2014, projected rises in anthropogenic influences and solar irradiance will increase global surface temperature 0.15 +/- 0.03 C, at a rate 50% greater than predicted by IPCC. But as a result of declining solar activity in the subsequent five years, average temperature in 2019 is only 0.03 +/- 0.01 C warmer than in 2014. This lack of overall warming is analogous to the period from 2002 to 2008 when decreasing solar irradiance also countered much of the anthropogenic warming.

Report on global warming predicts dire Illinois consequences

WASHINGTON -- If global warming continues unchecked, Chicago would see a repeat of the killer 1995 heat wave every summer by the middle of the century, an environmental group says in a study released Wednesday.

The report from the Union of Concerned Scientists also predicts that the city's air quality would deteriorate if humans do not scale back greenhouse gas emissions dramatically.

Illinois farmers would suffer from droughts, pests and flooding that would more than outweigh any potential benefits from a longer growing season caused by warmer temperatures. Heat stress in cattle could force the state's dairy industry to migrate north.

"Global warming represents an enormous challenge to Illinois' way of life and its residents' livelihoods," the authors write in conclusion.

More than 50 days a year would top 90 degrees in Chicago by mid-century, the report warns, up from a historical average of 15 per year. The city would average a heat wave per year on par with the city's 1995 scorcher, which authorities blamed for hundreds of deaths. Once every five years, the city would endure a heat wave similar to Europe's in 2003, which the authors project would kill more than 1,000 residents.

By century's end, the report projects, every Chicago summer would be hotter than 1983, the hottest summer on record for the city. Illinois' climate would resemble East Texas today, the report says.

The projections stem from an analysis of climate-modeling projections by the Intergovernmental Panel on Climate Change in a 2007 report.

The report includes two scenarios: one with heat-trapping gas emissions continuing to increase along current trend lines and one where countries take major steps to limit emissions.

Emissions limits would stave off many of the worst effects of warming in the middle and long term, the report concludes. But they would barely affect warming in the next three decades -- including a more than 50 percent increase in summer days topping 90 degrees -- because that warming has been essentially "locked in" by previous emissions.

"What we really have control over," said Melanie Fitzpatrick, a climate scientist for the Union of Concerned Scientists, "is our temperatures in the middle and end of the century."

Sunday, September 13, 2009

Global Warming Causes Outbreak Of Rare Algae Associated With Corals

A rare opportunity has allowed a team of biologists to evaluate corals and the essential, photosynthetic algae that live inside their cells before, during, and after a period in 2005 when global warming caused sea-surface temperatures in the Caribbean Ocean to rise.

The team, led by Penn State Assistant Professor of Biology Todd LaJeunesse, found that a rare species of algae that is tolerant of stressful environmental conditions proliferated in corals as the more-sensitive algae were being expelled from corals. The results will be published in the online version of the journal Proceedings of the Royal Society B on 9 September 2009.


"Symbiodinium trenchi is normally a rare species of micro-alga in the Caribbean," said LaJeunesse. "Because the species is apparently tolerant of high or fluctuating temperatures, it was able to take advantage of the warming event and become more prolific. In this way, Symbiodinium trenchi appears to have saved certain colonies of coral from the damaging effects of unusually warm water. As ocean temperatures continue to rise as a result of global warming, we can expect this species to become more common and persistent. However, since it is not normally associated with corals in the Caribbean, we don't know if its increased presence will benefit or harm corals in the long term."


According to LaJeunesse, certain species of algae have evolved over millions of years to live in symbiotic relationships with certain species of corals. The photosynthetic algae provide the corals with nutrients and energy, while the corals provide the algae with nutrients and a place to live. "There is a fine balance between giving and taking in these symbiotic relationships," said LaJeunesse. "If Symbiodinium trenchi takes from the corals more than it gives back, then over time we will see the health of the corals diminish."


In 2005, sea surface temperatures in the Caribbean Ocean rose by up to two degrees Celsius above normal for a period of three to four months, high enough and long enough to severely stress the natural symbioses. This process of damaged or dying algae being expelled from the cells of corals is known as bleaching because it leaves behind bone-white coral skeletons that soon will die without their symbiotic partners.


During the summer of 2005, prior to the bleaching event, LaJeunesse and his colleagues collected samples of coral and algae from two locations near Barbados in the Caribbean. "We collected the samples as part of an effort to document the diversity of Symbiodinium species around the world and to study how relationships between certain species of corals and algae differ across geographic space," he said.


By late November, water temperatures had peaked and many corals were bleached. "Finding out about the bleaching event was bittersweet," said LaJeunesse. "It was upsetting to see how severe the impact was to the coral communities, but I also knew it would be a good opportunity to learn more about what happens to corals and their algal partners during times of acute stress. In fact, I knew that this would be one of the first times that anyone had had the opportunity to conduct a community-wide study of corals and algae before, during, and after a bleaching event."


The team collected samples of coral and algae during the bleaching event and again two years after ocean temperatures returned to normal. In the laboratory, they sequenced the organisms' DNA to identify the species.


"During the bleaching event, we found that Symbiodinium trenchi, which we rarely find in the Caribbean, had increased in frequency by 50 percent, or more, within coral species that are most sensitive to warm water. We also saw this species in corals where it had never been before. Two years later, we found that the abundance and occurrence of Symbiodinium trenchi had diminished significantly," said LaJeunesse. Today, the symbioses have mostly recovered to their normal state, and the corals have been repopulated by their typical algal symbionts," he said.


Although Symbiodinium trenchi appears to have saved some Barbadian corals from possibly dying in 2005, LaJeunesse is concerned that the species might not be good for the corals in the long term in the event that warming trends continue and Symbiodinium trenchi becomes more common. "Because Symbiodinium trenchi does not appear to have successfully co-evolved with Caribbean coral species, it may not provide the corals with adequate nutrition," he said.


In the future, LaJeunesse plans to further investigate the relationships among Symbiodinium trenchi and Caribbean coral species. "We're interested in looking at how Symbiodinium trenchi behaves in other regions of the world where it is naturally common. We also want to look more closely at the give-and-take relationship between Symbiodinium trenchi and corals in the Caribbean.


This research was supported by the U. S. National Science Foundation, Florida International University, Penn State University, and the University of the West Indies.

Friday, September 11, 2009

A Skeptical Take on Global Warming

By Matt Rogers, Washington Post

This Capital Weather Gang blog entry is written with considerable trepidation given the politically-charged atmosphere surrounding human-induced global warming.


I am a meteorologist with a life-long weather fascination. As I'm sure you know, meteorology is an inexact science due to the large number of variables involved in predicting and understanding the weather. I frequently say that weather forecasting is a humbling endeavor, and I have learned to respect its challenges. From this perspective, you might be able to better understand why I wince when hearing pronouncements such as "the science is settled", "the debate is over", or even the "the temperature in the 2050s is projected to be..." I realize that forecasting climate and weather are different, but both involve a large number of moving parts.


There are numerous reasons why I question the consensus view on human-induced climate change covered extensively on this blog by Andrew Freedman. But for this entry, I scaled them down to ten:


(10) Hurricanes: One of the strongest value propositions presented for fighting global warming is to slow tropical cyclone intensity increases. Katrina was cited as a prime example. But the storm only made landfall as a category three (five being strongest) and affected a city built below sea level. Stronger storms have hit North America before, but the Katrina route and the weak levees made this situation much worse. I follow global hurricane activity closely and earlier this summer, we reached a record low. Florida State has a site that tracks global hurricane activity here. Since the 1990s, this activity has been decreasing, which goes against what we were told to expect on a warming planet.


(9) Ice Caps: In 2007, the Northern Hemisphere reached a record low in ice coverage and the Northwest Passage was opened. At that point, we were told melting was occurring faster than expected, and we needed to accelerate our efforts. What you were not told was that the data that triggered this record is only available back to the late 1970s. Prior to that, we did not have the satellite technology to measure areal ice extent. We know the Northwest Passage had been open before. In Antarctica, we had been told that a cooling of the continent was consistent with global climate models until a recent study announced the opposite was true. The lack of information and the inconsistencies do not offer confidence.


(8) El Niño: This feature in the Tropical Pacific Ocean occurs when water temperatures are abnormally warm. Some climate change researchers predicted that global warming would create more and stronger El Niño events like the powerhouse of 1997-98. Indeed in 2006, esteemed climate scientist James Hansen, predicted this. But we are now about to complete an entire decade without a strong El Niño event (three occurred in the 1980s-1990s). So the more recent 2007 IPCC report backtracked from Hansen's prediction, noting that there were too many uncertainties to understand how El Niño will behave with climate change. Recent research speaks to how important El Niño is to climate. In the past two decades, these warm El Niño and opposite cold La Niña events have accentuated the global temperature peaks and valleys highlighting the importance of natural variability and the limitations of the science.


(7) Climate Models: To be blunt, the computer models that policy-makers are using to make key decisions failed to collectively inform us of the flat global land-sea temperatures seen in the 2000s (see more on this in item 5 below). The UN IPCC did offer fair warning of model inadequacies in their 2007 assessment. They mentioned a number of challenges, which is wholly reasonable since countless factors contribute to our global climate system--many of them not fully understood. My belief is that they are over-estimating anthropogenic (human) forcing influences and under-estimating natural variability (like the current cold-phase Pacific Decadal Oscillation and solar cycles). The chaos theory describes why it is far more difficult to project the future than climate scientists may realize (I give them a break here since climate modeling is in its relative infancy). We poor hapless meteorologists learned the chaos theory lesson long ago.


(6) CO2 (Carbon Dioxide): The argument that the air we currently exhale is a bona fide pollutant due to potential impacts on climate change flummoxes me. CO2 is also plant food. Plants release oxygen for us, and we release CO2 for them. Over the summer, CO2 reached almost .04% of our total atmosphere as reported here. Because CO2 is but a sliver of our atmosphere, it is known as a "trace gas." We all agree that it is increasing, but is there a chance that our estimate of its influence on the Greenhouse Effect is overblown given its small atmospheric ratio?


(5) Global Temperatures: As a meteorologist, verification is very important for guiding my work and improving future forecasts. The verification for global warming is struggling. Three of four major datasets that track global estimates show 1998 as the warmest year on record with temperatures flat or falling since then. Even climate change researchers now admit that global temperature has been flat since that peak. As shown above, the CO2 chart continues upwards unabated. If the relationship is as solid as we are told, then why isn't global temperature responding? I'm told by climate change researchers that the current situation is within the bounds of model expectations. However, when I look at the IPCC 2007 AR4 WG1 report, I can see that without major warming in the next 1-2 years, we will fall outside those bounds. This is why I believe James Hansen is predicting a global temperature record in the next two years.


(4) Solar Issue: Look for this issue to get bigger. Our sun is currently becoming very quiet. Not only is the number of sunspots falling dramatically, but the intensity of the sunspots is weakening. The coincident timing of major solar minimums with cooler global temperatures (such as during the Little Ice Age) suggests that maybe the sun is underestimated as a component for influencing climate. The second half of the twentieth century (when we saw lots of warming) was during a major solar maximum period- which is now ending. Total solar irradiance has been steady or sinking similar to our global temperatures over much of this past decade. Indeed, recent research has suggested the solar factor is underestimated (here and here). Perhaps one day, we'll have a different version of James Carville's famous political quote...something like "It's the sun, stupid!"


(3) But what about...? Ultimately after I explain my viewpoint on climate change, I get this question: "But what about all this crazy weather we've been having lately?" As a student of meteorology, we learned about amazing weather events in the past that have not been rivaled in the present. Whether it was the 1900 Galveston Hurricane, the 1889 Johnstown Flood, or even the worst tornado outbreak in history (1974), we have and will continue to see crazy weather. Very few statistics are available that correctly show an increase in these "crazy" events.


(2) Silencing Dissent: I believe the climate is always changing. But what percentage of that change is human-induced? Like most, I believe that a more balanced energy supply benefits us politically due to the reduced reliance on foreign sources and benefits us locally due to improved air quality. But several times during debates individuals have told me I should not question the "settled science" due to the moral imperative of "saving the planet". As with a religious debate, I'm told that my disagreement means I do not "care enough" and even if correct, I should not question the science. This frightens me.


(1) Pullback: Does climate change hysteria represent another bubble waiting to burst? From the perspective of the alarmism and the saturation of the message, the answer could be yes. I believe that when our science or economic experts tend to be incorrect, it usually involves predictions that have underperformed expectations (Y2K, SARS, oil supply, etc). Can we think of any other expert-given, consensus-based, long-term predictions that have verified correctly? Not one comes to mind. I believe that predictions of human-caused climate change will continue to be overdone, and we'll discover that natural factors are equally and sometimes even more important.

Thursday, September 3, 2009

Woods Hole embraces the Medieval Warm Period – contradict Mann’s proxy data

“The more interesting and potentially controversial result is that our data indicate surface water temperatures during a part of the Medieval Warm Period that are similar to today’s…”


“Although there are significant uncertainties with our own reconstruction, our work raises the idea that perhaps even the Northern Hemisphere temperature reconstructions need to be looked at more closely.”


Woods Hole Oceanographic Institution: News Release : New Temperature Reconstruction from Indo-Pacific Warm Pool


The First Word in an Unfolding Story


August 27, 2009
Media Relations Office
93 Water Street MS #16
Woods Hole Oceanographic Institution

FOR IMMEDIATE RELEASE

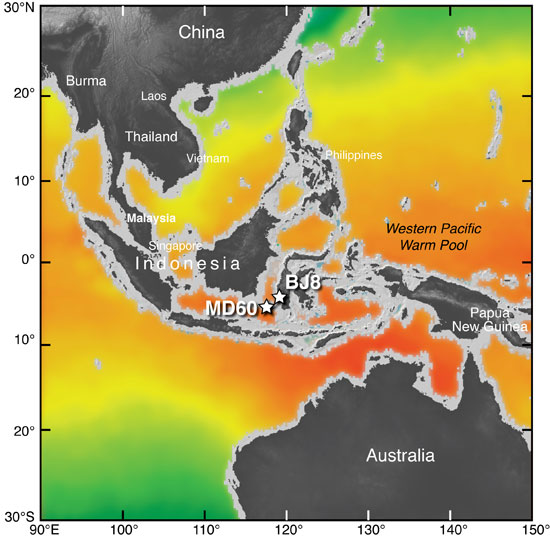
A map of the Indo-Pacific region indicates the locations of sediment cores used for the study. Station BJ8 marks the cores taken by Oppo and her colleagues. MD60 marks the site of published data. (Jack Cook, Woods Hole Oceanographic Institution)


A new 2,000 year long reconstruction of sea surface temperatures (SST) from the Indo-Pacific warm pool (IPWP) suggests that temperatures in the region may have been as warm during the Medieval Warm Period as they are today.


The IPWP is the largest body of warm water in the world, and, as a result, it is the largest source of heat and moisture to the global atmosphere, and an important component of the planet’s climate. Climate models suggest that global mean temperatures are particularly sensitive to sea surface temperatures in the IPWP. Understanding the past history of the region is of great importance for placing current warming trends in a global context.


The study is published in the journal Nature.


In a joint project with the Indonesian Ministry of Science and Technology (BPPT), the study’s authors, Delia Oppo, a paleo–oceanographer with the Woods Hole Oceanographic Institution, and her colleagues Yair Rosenthal of Rutgers State University and Braddock K. Linsley of the University at Albany-State University of New York, collected sediment cores along the continental margin of the Indonesian Seas and used chemical analyses to estimate water past temperatures and date the sediment. The cruise included 13 US and 14 Indonesian scientists.


“This is the first record from the region that has really modern sediments and a record of the last two millennia, allowing us to place recent trends in a larger framework,” notes Oppo.


Global temperature records are predominantly reconstructed from tree rings and ice cores. Very little ocean data are used to generate temperature reconstructions, and very little data from the tropics. “As palaeoclimatologists, we work to generate information from multiple sources to improve confidence in the global temperature reconstructions, and our study contributes to scientists’ efforts towards that goal,” adds Oppo.


Temperature reconstructions suggest that the Northern Hemisphere may have been slightly cooler (by about 0.5 degrees Celsius) during the ‘Medieval Warm Period’ (~AD 800-1300) than during the late-20th century. However, these temperature reconstructions are based on, in large part, data compiled from high latitude or high altitude terrestrial proxy records, such as tree rings and ice cores, from the Northern Hemisphere (NH). Little pre-historical temperature data from tropical regions like the IPWP has been incorporated into these analyses, and the global extent of warm temperatures during this interval is unclear. As a result, conclusions regarding past global temperatures still have some uncertainties.


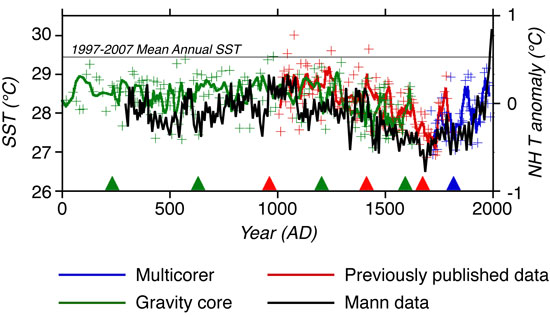
Sea surface temperature reconstructions from the Indo-Pacific Warm Pool. Different colored symbols indicate data from different cores used in the reconstruction. A northern hemisphere temperature reconstruction from Mann et al. (2008) is shown in the black curve. The previously published data is from Newton et al. (2006). Colored lines are the average of the data points. Triangles at the bottom of the figure show where age control exists. The horizontal black line labeled 1997-2007 Mean Annual SST shows the value of the annual average sea surface temperature for the same time period. The Little Ice Age, which occurred around A.D. 1700, was a cool period, but its magnitude was only about 0.5 to 1˚C cooler than modern winter temperatures. Water temperature during the late Medieval Warm Period, between about A.D. 1000 to 1250, was within error of modern annual sea surface temperatures. (Oppo, Rosenthal, Linsley; 2009)


Oppo comments, “Although there are significant uncertainties with our own reconstruction, our work raises the idea that perhaps even the Northern Hemisphere temperature reconstructions need to be looked at more closely.”


Comparisons

The marine-based IPWP temperature reconstruction is in many ways similar to land temperature reconstructions from the Northern Hemisphere (NH). Major trends observed in NH temperature reconstructions, including the cooling during the Little Ice Age (~1500-1850 AD) and the marked warming during the late twentieth century, are also observed in the IPWP.


“The more interesting and potentially controversial result is that our data indicate surface water temperatures during a part of the Medieval Warm Period that are similar to today’s,” says Oppo. NH temperature reconstructions also suggest that temperatures warmed during this time period between A.D. 1000 and A.D. 1250, but they were not as warm as modern temperatures. Oppo emphasizes, “Our results for this time period are really in stark contrast to the Northern Hemisphere reconstructions.”


Reconstructing Historical Temperatures


Records of water temperature from instruments like thermometers are only available back to the 1850s. In order to reconstruct temperatures over the last 2,000 years, Oppo and her colleagues used a proxy for temperature collected from the skeletons of marine plankton in sediments in the Indo-Pacific Ocean. The ratio of magnesium to calcium in the hard outer shells of the planktonic foraminifera Globigerinoides ruber varies depending on the surface temperature of the water in which it grows. When the phytoplankton dies, it falls to the bottom of the ocean and accumulates in sediments, recording the sea surface temperature in which it lived.


“Marine sediments accumulate slowly in general — approximately 3 cm/yr — which makes it hard to overlap sediment record with instrumental record and compare that record to modern temperature records,” says Oppo. “That’s what is different about this study. The sediment accumulates fast enough in this region to give us enough material to sample and date to modern times.”


The team generated a composite 2000-year record by combining published data from a piston core in the area with the data they collected using a gravity corer and a multi-corer. Tubes on the bottom of the multi-corer collected the most recently deposited sediment, therefore enabling the comparison of sea surface temperature information recorded in the plankton shells to direct measurements from thermometers.


Oppo cautions that the reconstruction contains some uncertainties. Information from three different cores was compiled in order to reconstruct a 2,000-year-long record. In addition sediment data have an inherent uncertainty associated with accurately dating samples. The SST variations they have reconstructed are very small, near the limit of the Mg/Ca dating method. Even in light of these issues, the results from the reconstruction are of fundamental importance to the scientific community.


More Questions to Answer

The overall similarity in trend between the Northern Hemisphere and the IPWP reconstructions suggests that that Indonesian SST is well correlated to global SST and air temperature. On the other hand, the finding that IPWP SSTs seem to have been approximately the same as today in the past, at a time when average Northern Hemisphere temperature appear to have been cooler than today, suggests changes in the coupling between IPWP and Northern Hemisphere or global temperatures have occurred in the past, for reasons that are not yet understood. “This work points in the direction of questions that we have to ask,” Oppo says. “This is only the first word, not the last word.”


The US National Science Foundation and the WHOI Ocean and Climate Change Institute provided funding for this work.


The Woods Hole Oceanographic Institution is a private, independent organization in Falmouth, Mass., dedicated to marine research, engineering, and higher education. Established in 1930 on a recommendation from the National Academy of Sciences, its primary mission is to understand the oceans and their interaction with the Earth as a whole, and to communicate a basic understanding of the oceans’ role in the changing global environment.

Tuesday, September 1, 2009

Treelines are Not Quite Responding to Climate Warming

A general premise is that treelines are thought to be more temperature sensitive, and so the rise in summer temperatures due to a warming climate should result in an advance of the treeline position.


A new study from the Bio-Protection Research Centre in New Zealand put that premise to test.


A treeline in Alaska

The researchers looked at 166 treeline sites with temperature data taken from the closest climate station to each site during the 20th century.

Results..........

---52% of the treeline sites advanced while the overall temperature increased during the long-term period.
--47% of the treeline sites remained stable.
--1% receded.


"Surprisingly these results reveal that treelines are not universally responding to climate warming by advancing, as expected," said Melanie Harsch, "However they demonstrate the importance of temperature on treeline advance over other factors such as disturbance, latitude, scale, elevation and distance to the ocean; none of which demonstrated strong relationships with the probability of treeline advance."


These results provide no evidence of the prevailing view that high altitude and latitude treelines are controlled only by summer temperatures. Instead they show that treelines are more likely to advance at sites that had warmed during the winter months, according to the ScienceDaily article.


Summer temperature is widely considered to be the primary control of treeline formation and maintenance, whereas winter temperatures have previously been considered less critical because of the insulative effects of snow.


"These results show that treelines are responding to warming, but are not consistent in that only half of the sites showed signs of advance despite most sites experiencing warming," said Harsch.

Glaciers defied hotter temperatures 9000 years ago

Ice, when heated, is supposed to melt.

That’s why a collection of glaciers in the Southeast Himalayas stymies those who know what they did 9,000 years ago. While most other Central Asian glaciers retreated under hotter summer temperatures, this group of glaciers advanced from one to six kilometers.


A new study by BYU geologist Summer Rupper pieces together the chain of events surrounding the unexpected glacial growth.


“Stronger monsoons were thought to be responsible,” said Rupper, who reports her findings in the September issue of the journal Quaternary Research. “Our research indicates the extra snowfall from monsoonal effects can only take credit for up to 30 percent of the glacial advance.”


As Central Asia’s summer climate warmed as much as 6 degrees Celsius, shifting weather patterns brought more clouds to the Southeast Himalayas. The additional shade created a pocket of cooler temperatures.


Temperatures also dropped when higher winds spurred more evaporation in this typically humid area, the same process behind household swamp coolers.


The story of these seemingly anomalous glaciers underscores the important distinction between the terms “climate change” and “global warming.”


“Even when average temperatures are clearly rising regionally or globally, what happens in any given location depends on the exact dynamics of that place,” Rupper said.


The findings come from a framework Rupper developed as an alternative to the notion that glaciers form and melt in direct proportion to temperature. Her method is based on the balance of energy between a glacier and a wide range of climate factors, including wind, humidity, precipitation, evaporation and cloudiness.


Gerard Roe and Alan Gillespie of the University of Washington are co-authors of the new study.


Knowing how glaciers responded in past periods of climate change will help Rupper forecast the region’s water supply in the coming decades. She and collaborators are in the process of determining how much of the Indus River comes from the vast network of glaciers far upstream from the agricultural valleys of India and Pakistan.


“Their study can be used to help assess future glaciological and hydrological changes in the most populated part of our planet, which is a region that is now beginning to experience the profound effects of human-induced climate change,” said Lewis Owen, a geologist at the University of Cincinnati who was not affiliated with this study.


Study: Glaciers defied hotter temperatures 9000 years ago

BYU professor Summer Rupper doing field work with Switzerland's Gornergrat glacier. Her newest study details how a group of Himalayan glaciers grew despite a significant rise in
temperatures.


Monday, June 8, 2009

By 2050, Poland Will Be Like Sicily

Global warming is changing everything about our lives. It is changing how insects spread disease to us and plants. It is melting the ice that dominates the poles and it is causing the complete altering of climate patterns, leading to mass extinctions. As it turns out, global warming could also be changing where people take their vacations in 2050.

As things get warmer, typically milder and colder places begin to have longer and hotter summers. Such is the case with Poland and Hungary, which are expected to have a climate more like Sicily and Spain by mid-century.

Right now, Hungary and Poland have 22 days above 30 degrees C each year. According to a new study, the number of days above 30 degrees C will increase to 37 by 2050.
It is generally accepted that places like Poland, Russia, Canada, Scandinavian countries and the Ukraine will benefit greatly from global warming due to longer growing seasons and more rainfall. However, there are many more countries that will not benefit at all and could see a complete collapse of their social order.

According to the study, countries in the former Soviet Union that will be hurt the most by global warming are Tajikistan, Albania and Kyrgyzstan, while Slovenia, Czech Republic and Estonia are former Soviet provinces that will benefit the most.

So, in 2050 are we going to be getting our wine from Poland? If Poland is going to be like Sicily, does that mean Sicily will be more like Northern Africa? Or the Sahara? With global warming, for every benefit for countries like Poland, there are many more disadvantages for countries like Italy, Greece, Turkey and Spain. These countries will be completely altered due to global warming and they could find themselves as a barren wasteland. What can be said is that as the world warms, more and more people will move to the north. For countries like Canada, which has a very low population, that could lead to a conflict as more people want what we have here in Canada.

Until that time, begin enjoying the wine coming out of Poland, I hear the vintage of 2047 is supposed to be great.

Monday, May 25, 2009

Causes, Effects and Dangers of Global Warming

report by allie mendoza

What can we possibly do to help stop global warming? How do we solve a problem that seems too large to tackle and too complex to understand?

Earth Egg

by azrainman


We’ve all heard about global warming blaring from our TV sets and radios… we’ve seen countless web pages and news prints. Can we really continue to turn our heads away and pretend we don’t have enough evidence to take action?

By the time we get evidence that’s convincing enough for the global warming skeptics, will it be too late for the world as we know it?


By not taking action now, are we putting at risk the only planet we call home… for the off chance that global warming is NOT really going to cause massive destruction?


Are we willing to risk the environment that our children and future generations are going to inherit?


What Is Global Warming?

Global warming refers to the increase in the temperature of the Earth’s atmosphere. This results in the increase of our global average temperature.


It’s hard to understand why some people are still wondering if global warming is really occurring — the evidence provided is overwhelming.


It’s NOT reasonable to suggest that global warming is not occurring… just because we’ve had a couple of pretty cold winters lately. It’s NOT reasonable to compare “a couple of cold winters” to decades or centuries of OVERWHELMING EVIDENCE showing global warming.


For most people — especially most scientists — the only questions remaining are how much and how fast global warming will continue.


What Are the Main Causes of Global Warming?

The atmosphere has a natural supply of carbon dioxide (CO2) and other gases. These gases capture heat and create a warming effect on the surface of the Earth. This warming effect is similar to warming inside a greenhouse; so, it became known as the “greenhouse effect.”


Without the greenhouse effect, the Earth would not be warm enough for us to live on. It would just be a frozen wasteland.


Before the Industrial Revolution, the amount of natural emissions of CO2 and other greenhouse gases matched what could be removed. When the greenhouse gas emissions and removal were balanced, the greenhouse effect was good — it kept the Earth just warm enough to be habitable.


After the Industrial Revolution, increasingly larger amounts of greenhouse gas emissions were caused by humans. More and more fossil fuels — such as, oil, coal and natural gas — were burned to run factories, power plants, planes, cars and trucks. These human-caused emissions added significantly to the natural sources of greenhouse gases.


As a result, the greenhouse gases are building up beyond the Earth’s natural capacity to remove them. Since these atmospheric gases capture heat, this increase in gas emissions is causing an increase in global warming.


Global warming has increased the temperature of the Earth by about one degree Fahrenheit over the past century… with the last two decades heating up more intensely.


Why should an increase of one degree Fahrenheit matter to us?


If you consider that the difference in average global temperatures between modern times and the last ice age was only about 9 degrees Fahrenheit, it becomes clear that one degree is very significant.


This increase in global warming can cause a dramatic shift in our climate that can have devastating consequences… NOT just for the environment, but for our way of life.


What Are the Effects of Global Warming?

By burning more and more fossil fuels, human activities are adding CO2 much faster than the Earth’s natural capacity can remove.


CO2 is the main pollutant of global warming. Studies have shown that even small changes in CO2 levels lead to significant changes in average global temperature.


Due to human activities, CO2 emissions in the atmosphere have increased by 31% above pre-industrial levels — there is more CO2 in the atmosphere now than at any other time in the last 650,000 years.


Increasing the amount of CO2 and other greenhouse gases increases the greenhouse effect. This intensifies global warming.


If we don’t effectively reduce CO2 and other greenhouse gas pollution, it is predicted that global warming will increase the Earth’s average temperature by another 2.0 degrees Fahrenheit to 11.5 degrees Fahrenheit by 2100.


Even at the lower end of the predicted temperature, global warming and the resulting climate warming can lead to more intense storms, rising sea levels and more pronounced droughts.


At the high end of the predicted increase in temperature, global warming could lead to irreversible, catastrophic environmental consequences.


Read on to find out what can happen to your city, country or industry due to global warming…


What Are the Dangers of Global Warming?

The Earth has been showing signs and symptoms of global warming for quite some time. For many decades, scientists have been warning all of us about the dangers of global warming… but, few people paid much attention.The Earth is “talking” to us again… it’s message is loud and clear. If we continue to ignore it’s warning, we will suffer catastrophic environmental consequences on a scale previously unknown to our civilization.


Dangers Of Sea Level Rising

Currently, sea level is rising at 1/10 inch each year. Water expands when it is heated. So, with the global warming effect of CO2 already in our atmosphere, sea level can continue to rise for many centuries. To make matters worse, water melted from glaciers can also add to the sea level rising.


The impacts of rising sea level can include, flooding of cities, displacement of the people and loss of coastal ecosystems.


* If sea level rises 12 inches, 17%-43% of coastal wetlands in the United States could be eliminated… with more than half the loss in Louisiana. If sea level rises 24 inches, the United States could lose 10,000 square miles of dry land.


* Many of our cities face a severe risk of flooding. Thirteen out of fifteen of the largest cities in the world are on coastal plains. In California, parts of San Jose and Long Beach are three feet below sea level today. New Orleans is about eight feet below sea level.


* Bangladesh is projected to lose 17.5% of it’s land if sea level rises about 40 inches. With coastal flooding, tens of thousands of people are likely to be displaced. Plants and animals will also be lost.


* Many islands throughout the South Pacific and Indian Oceans as well as Maldives and French Polynesia will simply disappear under the rising seas. If the sea level rises 20 inches, 80% of the Majuro Atoll in the Pacific Marshall Islands will be under water.


Dangers of Infectious Diseases Spreading

Cold weather reduces the spread of infectious diseases by killing infectious organisms and their carriers, such as, mosquitoes. Global warming could increase the spread of malaria, dengue fever and yellow fever.


According to the World Health Organization, malaria has already spread to higher altitudes in places like the Columbian Andes, which is 7000 feet above sea level.


Dangers of Global Warming On Ecosystems

Millions of species worldwide could be driven to extinction due to global warming.

There are only about 3000-4500 Bengal tigers remaining in the wild. More tigers will be lost in Bangladesh as a result of global-warming related rise in sea levels.


With a 7-9 degree F change in mid-winter temperatures associated with the melting of sea ice pack on the western Antarctic Peninsula, shifting in penguin populations has been observed. Adelie penguins inhabit winter ice pack while Chinstrap penguins inhabit the open water. Chinstrap penguin populations increased by 400% in the last 25 years while Adelie penguins decreased by 22%.


Dangers of Disappearing Glaciers and Ice Packs

Almost all of the mountain glaciers on Earth have been shrinking and disappearing over the last century. With melting ocean ice cover, wildlife and humans will be seriously affected.


Walruses and polar bears have been observed to be thin and in poor condition due in part to the melting sea ice.


Deadly Heat Waves Are More Likely and More Frequent

In July 1995, 739 people in Chicago died when the temperature hit a record 106 degrees F. According to the Centers for Disease Control, access to air conditioning could have saved hundreds of lives… but, 49,000 homes lost power and air conditioning.


By the second day of the five-day heat wave, medical emergency rooms exceeded capacity. About 23 hospitals were closed to new patients. So, ambulances had to drive around town with nowhere to unload their patients. The morgue overflowed. Nine 48-foot meat trucks had to be brought in to store the dead bodies.


The world’s deadliest heat wave struck Europe in August 2003. A staggering 27,000 people in England, France, Germany and other parts of Europe died from the heat wave. More than 14,000 people died in France alone.


Survivors of the heat wave also suffered from dehydration, heat stroke, advanced stages of shock and fevers as well as irreversible brain damage.


Health spending was increased by $6.8 billion over five years by the French government. Due to the heat wave, medical costs soared.


Destructive Hurricanes Are More Likely and More Frequent

Hurricanes are fueled by warm ocean waters. Global warming, which is heating up ocean waters, is predicted to lead to more intense hurricanes.


According to a 2005 study done by Massachusetts Institute of Technology, the destructive potential of tropical storms has doubled over the past 30 years. According to a study done by Georgia Institute of Technology, the number of Category 4 and 5 hurricanes has doubled since the 1970s.


The destruction caused by Hurricane Katrina in 2005 shocked the world. Global warming is predicted to lead to more destructive hurricanes more frequently.


Global Warming Could Lead to Devastating Consequences For Our Economy

* If there isn’t enough snow or snow can not be created due to global warming, America’s $4.5 billion ski industry is dead.


* Global warming could lead to financial disasters for lobstermen. Studies have shown that temperatures ranging from 75 to 86 degrees F are lethal to lobsters.


In 1999, lobsters were dying in record numbers. By 2003, lobster populations were down 70% compared to 1998 levels.


* The taste and quality of wine depend on the soil and climate conditions in which the grapes are grown. Higher temperatures and less precipitation as well as more frequent and severe droughts due to global warming could have devastating effects on California’s $15 billion wine industry.


* And so on… and so on…


This post covered the causes, effects and dangers of global warming. The next post will cover how we can prevent, stop or slow global warming — even small changes can make a big difference.

Bidecadal Oscillations In Globally Averaged Temperature Trends

Basil Copeland and Anthony Watts
sun-earth-moon-520

Image from NASA GSFC


Many WUWT readers will remember that last year we presented evidence of what we thought was a “solar imprint” in globally averaged temperature trends. Not surprisingly, given the strong interest and passion in the subject of climate change and global warming, our results were greeted with both praise and scorn. Some problems were pointed out in our original assessment, and other possible interpretations of the data were suggested. Some WUWT readers have wondered whether we would ever follow up on this.


We have been quietly working on this, and having learned much since our initial effort, are as persuaded as ever that the basic premise of our original presentation remains valid. We have tried out some new techniques, and have posted some preliminary trials on WUWT in the past few months, here, and here.


However, questions remain. Since a lot of bright and capable people read WUWT, rather than wait until we thought we had all the answers, we have decided to present an update and let readers weigh in on where we are at with all of this. We have, in fact, drafted a paper that we might at some point submit for peer review, when we are more comfortable with some of the more speculative aspects of the matter. What follows is taken from that draft, with some modification for presentation here.


For those that prefer to read this in printed form, a PDF of this essay is available for download here


Introduction

Evidence of decadal and bidecadal variations in climate are common in nature. Classic examples of the latter include the 20 year oscillation in January temperature in the Eastern United States and Canada reported by Mock and Hibler [1], and the bidecadal rhythm of drought in the Western High Plains, Mitchell, Stockton, and Meko [2], and Cook, Meko, and Stockton [3]. Other examples include a bidecadal (and pentadecadal) oscillation in the Aleutian Low, Minobe [4]; rainfall and the levels of Lake Victoria, East Africa, Stager et al. [5]; and evidence from tree rings along the Russian Arctic, Raspopov, Dergachev, Kolstrom [6], and the Chilean coast, Rigozo et al. [7].


Evidence of decadal or bidecadal oscillations in temperature data, however, especially upon a global scale, has proven to be more elusive and controversial. Folland [8] found a spectral peak at 23 years in a 335 year record of central England temperatures, and Newell et al. [9] found a 21.8 year peak in marine air temperature. Brunetti, Mageuri, Nanni [10] have reported evidence of a bidecadal signal in Central European mean alpine temperatures. But the first to report bidecadal oscillations – of 21 and 16 years – in globally averaged temperature were Ghil and Vautard [11]. Their results were challenged by Eisner and Tsonis [12], but were later taken up and extended by Keeling and Whorf [13, 14].


No less unsettled is the issue of attribution. Currie [15], examining U.S. temperature records, reported spectral peaks of 10.4 and 18.8 years, attributing the first to the solar cycle, and the latter to the lunar nodal cycle. In the debate over the bidecadal drought cycle of the Western High Plains, Mitchell, Stockton, and Meko [2] concluded that the bidecadal signal was a solar phenomenon, not a lunar one. Bell [16, 17] and Stockton, Mitchell, Meko [18] attributed the bidecadal drought cycle to a combined solar and lunar influence, as did Cook, Meko, and Stockton [3]. Keeling and Whorf [13], working with globally averaged temperature data, reported strong spectral peaks at 9.3, 15.2, and 21.7 years. Eschewing a simpler combination of solar and lunar influences, they proposed a complex mechanism of lunar tidal influences to explain the evidence [14].


The past decade has seen only sporadic interest in the question of whether decadal and bidecadal variations in climate have a solar or lunar attribution, or some combination of the two. Cerveny and Shaffer [19] and Treloar [20] report evidence of tidal influences on the southern oscillation and sea surface temperatures; Yndestad [21, 22] and McKinnell and Crawford [23] attribute climate oscillations in the Arctic and North Pacific to the 18.6 year lunar nodal cycle. But interest in discerning an anthropogenic influence on climate has largely eclipsed the study of natural climate variability, at least on a global scale. There continue to be numerous reports of decadal or bidecadal oscillations in a variety of climate metrics on local and regional scales, variously attributed to solar and or lunar periods [3-7, 10, 19-27], but little has been done to advance the state of knowledge of lunar or solar periodic cycles on globally averaged temperature trends since the final decade of the 20th Century.


Besides the shift in interest to discerning an anthropogenic influence on global climate, the lack of agreement on any kind of basic physical mechanism for a solar role in climate oscillations, combined with the apparent lack of consistency in the relation between solar cycles and terrestrial temperature trends perhaps has made this an uninviting area of research. The difficulty of attributing temperature change to solar influence has been thoroughly surveyed by Hoyt and Schatten [28]. In particular, there are numerous reports of sign reversals in the relationship between temperature and solar activity in the early 20th century, particularly after 1920 [28, pp 115-117]. More recently, Georgieva, Kirov, and Bianchi [29] surveyed comprehensively the evidence for sign reversal in the relationship between solar and terrestrial temperatures, and suggested that these sign reversals are related to a long term secular solar cycle with solar hemispheric asymmetry driving the sign reversals. Specifically, they argue that there is a double Gleissberg cycle in which during one half of the cycle the Southern solar hemisphere is more active, while during the other half of the cycle the Northern solar hemisphere is more active. They argue that this solar hemispheric asymmetry is correlated with long term terrestrial climate variations in atmospheric circulation patterns, with zonal circulation patterns dominating in the 19th and early 20th century, and meridional circulation patterns dominating thereafter (see also [30] and [31]).


In our research, we pick up where Keeling and Whorf [13, 14] leave off, insofar as documenting decadal and bidecadal oscillations in globally averaged temperature trends is concerned, but revert to the explanation proposed by Bell [16] and others [3, 18], that these are likely the result of a combined lunisolar influence, and not simply the result of lunar nodal and tidal influences. We show that decadal and bidecadal oscillations in globally averaged temperature show patterns of alternating weak and strong warming rates, and that these underwent a phase change around 1920. Prior to that time, the lunar influence dominates, while after that time the solar influence dominates. While these show signs of being correlated with the broad secular variation in atmospheric circulation patterns over time, the persistent influence of the lunar nodal cycle, even when the solar cycle dominates the warming rate cycles, implicates oceanic influences on secular trends in terrestrial climate. Moreover, while analyzing the behavior of the secular solar cycle over the limited time frame for which we have reasonably reliable instrumental data for measuring globally averaged temperature should proceed with caution, if the patterns documented here persist, we may be on the cusp of a downward trend in the secular solar cycle in which solar activity will be lower than what has been experienced during the last four double sunspot cycles. These findings could influence our expectations for the future regarding climate change and the issue of anthropogenic versus natural variability in attributing climate change.


In our original presentation, we utilized Hodrick-Prescott smoothing to reveal decadal and bidecadal temperature oscillations in globally averaged temperature trends. While originally developed in the field of economics to separate business cycles from long term secular trends in economic growth, the technique is applicable to the time series analysis of temperature data in reverse, by filtering out short term climate oscillations, isolating longer term variations in temperature.


For the mathematically inclined, here is what the HP filter equation looks like, courtesy of the Mathworks

The Hodrick-Prescott filter separates a time series yt into a trend component Tt and a cyclical component Ct such that yt = Tt + Ct. It is equivalent to a cubic spline smoother, with the smoothed portion in Tt.

The objective function for the filter has the form

Figure0

where m is the number of samples and λ is the smoothing parameter. The programming problem is to minimize the objective over all T1, …, Tm. The first sum minimizes the difference between the time series and its trend component (which is its cyclical component). The second sum minimizes the second-order difference of the trend component (which is analogous to minimization of the second derivative of the trend component).

For those with an electrical engineering background, you could think of it much like a bandpass filter, which also has uses in meteorology:


Outside of electronics and signal processing, one example of the use of band-pass filters is in the atmospheric sciences. It is common to band-pass filter recent meteorological data with a period range of, for example, 3 to 10 days, so that only cyclones remain as fluctuations in the data fields.


(Note: For those that wish to try out the HP filter on data themselves, a freeware Excel plugin exists for it which you can download here)


When applied to globally averaged temperature, the HP filter works to extract the longer term trend from variations in temperature that are of short term duration. It is somewhat like a filter that filters out “noise,” but in this case the short term cyclical variations in the data are not noise, but are themselves oscillations of a shorter term that may have a basis in physical processes.


This approach reveals alternating cycles of weak and strong warming rates with decadal and bidecadal frequency. We confirm the validity of the technique using a continuous wavelet transform. Then, using MTM spectrum analysis, we analyze further the frequency of these oscillations in global temperature data. Using sinusoidal model analysis we show that the frequencies obtained using HP smoothing are equivalent to what are obtained using MTM spectrum analysis. In other words, the HP smoothing technique is simply another way of extracting the same spectral density information obtained using more conventional spectrum analysis, while leaving it in the time domain. This allows us to compare the secular pattern of temperature cycles with solar and lunar maxima, yielding results that are not obvious from spectral analysis alone.


Using the Hodrick-Prescott Filter to Reveal Oscillations in Globally Averaged Temperature

We use the open source econometric regression software gretl (GNU Regression, Econometrics, and Time Series) [34] to derive an HP filtered time series for the HadCRUT3 Monthly Global Temperature Anomaly, 1850:01 through 2008:11 [35].

Figure1

Figure1 - click for larger image

Figure 1 is representative output in gretl for a series filtered with HP smoothing (λ of 129,000). In the top panel is the original series (in gray), with the resulting smoothed trend (in red). In the bottom panel is the cyclical component. In econometric analysis, attention usually focuses on the cyclical component. Our focus, though, is on the trend component in the upper panel, and in particular the first differences of the trend component. The first differences of a trend indicate rate of change.


By taking the first differences of the smoothed trend in Figure 1, we obtain the series (in blue) shown in Figure 2, plotted against the background of the original data (gray), and the smoothed trend (red).

Figure 2 - click for larger image

Figure 2 - click for larger image

What does this reveal? At first glance, we see an alternating pattern of decadal and bidecadal oscillations in the rate of warming, with a curious exception circa 1920-1930. We will return to this later. Concentrating for now on the general pattern, these oscillations in the rate of warming are representations, in the time domain, of spectral frequencies in the temperature data, with high frequency oscillations filtered out by the HP smoothing.


As evidence of this, Figure 3 presents the result of two Morelet continuous wavelet transforms, the first (in the upper panel) of the unfiltered HadCRUT3 monthly time series, and the second (in the lower panel) of results obtained with HP smoothing.

Figure3

The wavelet transforms below a frequency of ~7 years (26.4 ≈ 84 months) are visually identical; the HP filter is simply acting as a low pass filter, filtering out oscillations with frequencies above ~7 years, while preserving the decadal and bidecadal oscillations of interest here. In the next section, we investigate these oscillations in further detail, supplementing our results from HP filtering with MTM spectrum analysis, and a sinusoidal model fit.


Frequency Analysis

Figure 4 is an MTM spectrum analysis of the unfiltered HadCRUT3 monthly global temperature analysis.

Figure 4 - click for larger image

Figure 4 - click for larger image

A feature of MTM spectrum analysis is that it distinguishes signals that are described as “harmonic” from those that are merely “quasi-oscillatory.” In MTM spectrum analysis a harmonic is a more clearly repeatable signal that passes a stronger statistical test of its repeatability. Quasi-oscillatory signals are statistically significant, in the sense of rising above the background noise level, but are not as consistently repeating as the harmonic signals.


The distinction between harmonic and quasi-oscillatory signals is well illustrated in Figure 4 by the two cycles that interest us the most – a “quasi-oscillatory” cycle with a peak at 8.98 years, and a “harmonic” signal centered at 21.33 years. Also shown are a harmonic, and a quasi-oscillatory cycle, of shorter frequencies, possibly ENSO related. The harmonic at 21.33 years in Figure 4 encompasses a range from 18.96 to 24.38 years, and the quasi-oscillatory signal that peaks at 8.93 years has sidebands above the 99% significance level that range from 8.53 to 10.04 years. These signals are consistent with spectra identified by Keeling and Whorf [13,14].


Figure 5 is an MTM spectrum analysis of the HP smoothed first differences.

figure5

Figure5 - click for larger image

The basic shape of the spectrum is unchanged, but it is now well above the background noise level because of the HP filtering. Attention is drawn in Figure 5 to four oscillatory modes or cycles because they correspond to the four strongest cycles derived from using the PAST (PAleontological STatistics) software [36] to fit a sinusoidal model to the HP smoothed first differences.


Shown in Figure 6, the sinusoidal fit results in periods of 20.68, 9.22, 15.07 and 54.56 years, in that order of significance. These periodicities fall within the ranges of the spectra obtained using MTM spectrum analysis, and yield a sinusoidal model with an R2 of 0.60.

Figure6

Figure6 - click for larger image


Discussion

The first differences of the HP smoothed temperature series, shown in Figure 2 and Figure 6, show a pattern of alternating decadal and bidecadal oscillations in globally averaged temperature. From the sinusoidal model fit, these cycles have average frequencies of 20.68 and 9.22 years, results that are consistent with the MTM spectrum analysis, and with spectra in the results published by Keeling and Whorf [13, 14]. But to what can we attribute these persistent periodicities?


A bidecadal frequency of 20.68 years is too short to be attributed solely to the double sunspot cycle, and too long to be attributed solely to the 18.6 year lunar nodal cycle. There is indeed evidence of a spectral peak at ~15 years, which Keeling and Whorf combined with their evidence of a 21.7 year cycle to argue for attributing the oscillations entirely to the 18.6 year lunar nodal cycle.


But our evidence indicates that the ~15 year spectrum is much weaker, is not harmonic, and probably derives from the anomalous behavior of the spectra circa 1920-1930, something Keeling and Whorf could not appreciate with evidence only from the frequency domain. Especially in light of the evidence presented below, and because the bidecadal signal is harmonic, and readily discernible in the time domain representation of Figure 2 and Figure 6, we believe that a better attribution is the beat cycle explanation proposed by Bell [16], i.e. a cycle representing the combined influence of the 22 year double sunspot cycle and the 18.6 year lunar nodal cycle.


As for the decadal signal of 9.22 years, this is too short to be likely attributable to the 11 year solar cycle, but is very close to half the 18.6 year lunar nodal cycle, and thus may well be attributable to the lunar nodal cycle. Together, the pattern of alternating weak and strong warming cycles shown in Figure 2 and Figure 6 suggest a complex pattern of interaction between the double sunspot cycle and the lunar nodal cycle.


This complex pattern of interaction between the double sunspot cycle and lunar nodal maxima in relation to the alternating pattern of decadal and bidecadal warming rates is demonstrated further in Figure 6 with indicia plotted to indicate solar and lunar maxima. Since circa 1920, the strong warming rate cycles have tended to correlate with solar maxima associated with odd numbered solar cycles, and the weak warming rate cycles with lunar maxima.


Prior to 1920, the strong warming rate cycles tend to correlate with the lunar nodal cycle, with the weak warming rate cycles associated with even numbered solar cycles. The sinusoidal model fit begins to break down prior to 1870. Whether this is a reflection of the poorer quality of data prior to 1880, or indications of an earlier phase shift, we cannot say, though the timing would be roughly correct for the latter. But the anomalous pattern circa 1920, when viewed against the shift from strong warming rate cycles dominated by the lunar nodal cycle, to strong warming rate cycles dominated by the double sunspot cycle, has the appearance of a disturbance associated with what clearly seems to be a phase shift


These results agree with the evidence mustered by Hoyt and Schatten [28] and Georgieva, Kirov, and Bianchi [29] for a phase shift circa 1920 in the relationship between solar activity and terrestrial temperatures. However, we can suggest, here, that the supposed negative correlation between solar activity and terrestrial temperatures prior to 1920 rests on a misconstrued understanding of the data. As can be seen in Figure 6, the relationship between the change in the warming rate and solar activity is still positive, i.e. the warming rate is peaking near the peaks of solar cycles 10, 12, and 14, but at a much reduced level, indicative of the lower level of solar activity during the period. Indeed, for much of solar cycle 12, and all of solar cycle 14, the “warming” rate is negative, but the change in the warming rate is still following the level of solar activity, becoming less negative as solar activity increases, and more negative as solar activity decreases. Still, there is a strong suggestion in Figure 6 of a phase shift circa 1920 in which the relationship between solar activity and terrestrial temperatures changes dramatically before and after the shift. Before the shift, the lunar period dominates, and the solar period is much weaker. After the shift, the solar period dominates, and the lunar period becomes subordinate.


Speculating

To this point, we believe that we are on relatively solid ground in describing what the data show, and the likelihood of a lunisolar influence on global temperatures on decadal and bidecadal timescales. What follows now is more speculative. To what can we attribute the apparent phase shift circa 1920, evident not just in our findings, but as reported by Hoyt and Schatten [28] and Georgieva, Kirov, and Bianchi [29]? While the period of data is too short to do more than speculate, the periods before and after the phase shift appear to be roughly equivalent in length to the Gleissberg cycle.


Since 1920, we’ve had four double sunspot cycles with strong warming rates ending in odd numbered cycles. Prior to 1920, while the results are less certain at the beginning of the data period, there is a reasonable interpretation of the data in which we see four bidecadal periods dominated by the influence of the lunar cycle. These differences may be attributable to the broad swings in atmospheric “circulation epochs” discussed by Georgeiva, et al. [30], characterized either predominantly by zonal circulation, or meridional circulation. With respect to the period of time shown in Figure 6, zonal circulation prevailed prior to 1920, and since then meridional circulation has dominated. These “circulation epochs” may have persistent influence on the relative roles of solar and lunar influence in warming rate cycles.


While the role of variation in solar irradiation over the length of a solar cycle on the broad secular rise in global temperature is disputed, we are presenting here evidence primarily of a more subtle repeated oscillation in the rate of change in temperature, not its absolute level. As shown in Figure 2 and Figure 6, the rate of change oscillates between bounded positive and negative values (with the exception circa 1920 duly noted). Variations in solar irradiance over the course of the solar cycle are a reasonable candidate for the source of this variation in warming rate cycle. As WUWT’s “resident solar physicist”, Leif Svalgaard, has pointed out, variations in TSI over a normal solar cycle can only account for about 0.07°C of total variation over the course of a solar cycle. The range of change in warming rates shown in Figure 2 and Figure 6 are at most only about one-tenth of this, or about ~0.006°C to ~0.008°C. If anything, we should be curious why the variation is so small. We attribute this to the averaging of regional and hemispheric variations in the globally averaged data. On a regional basis, analysis [not presented here] shows much larger variation, but still within the range of 0.07°C that might plausibly be attributed to the variation in TSI over the course of a solar cycle.


So variations in solar irradiance over the course of the solar cycle are a reasonable candidate for the source of this variation in warming rate cycle. At the same time, the lunar nodal cycle may be further modulating this natural cycle in the rate of change in global temperatures. As to the degree of modulation, that may be influenced by atmospheric circulation patterns. With zonal circulation, the solar influence is moderated and the lunar influence dominates the modulation of the warming rate cycles. With meridional circulation, the solar influence is stronger, and the warming rate cycles are dominated by the solar influence.


At this writing, we are in the transition from solar cycle 23 to 24, a transition that has taken longer than expected, and longer than the transitions typical of solar cycles 16 through 23. Indeed, the transition is more typical of the transitions of solar cycles 10 through 15. If the patterns observed in Figure 6 are not happenstance, we may be seeing an end to the strong solar activity of solar cycles 16-23, and a reversion to the weaker levels of activity associated with solar cycles 10-15. If that occurs, then we should see a breakdown in the correlation between warming rate cycles and solar cycles at bidecadal frequencies, and a reversion to a dominant correlation between temperature oscillations and the lunar nodal cycle.


Interestingly, there was a lunar nodal maximum in 2006 not closely associated with the timing of decadal or bidecadal oscillations in globally averaged temperature. This could be an indication of a breakdown in the pattern similar to what we see in the 1920’s, i.e. the noise associated with a phase shift in the weaker warming rate cycles will occur at times of the solar maximum, and the stronger warming rate cycles will occur at times of lunar nodal maximum.


Repeating, there appear to be parallels between our findings and the argument of Georgieva et al. [29] of a relationship between terrestrial climate and solar hemispheric asymmetry on the scale of a double Gleissberg cycle. Solar cycles 16-23, associated as we have seen with increased solar activity, and strong correlations with the strong terrestrial warming rate cycles of bidecadal frequency, represent 8 solar cycles, a period of time associated with a Gleissberg cycle.


While the existence of Gleissberg length cycles is hardly challenged, their exact length and timing is subject to a debate we will not entertain here at any length. Javariah [37] on the basis of the disputed 179 year cycle of Jose [38] believes that a descending phase of a Gleissberg cycle is already underway, and will end with the end of a double Hale cycle comprising solar cycles 22-25.


While it is true that solar activity, as measured by SSN, is already on the decline, we would include the double Hale cycle 20-23 in the recent peak of solar activity, and not necessarily expect to see the bottom of the current decline in solar activity that quickly.


The issue here can perhaps be framed with respect to Figure 7 below:

figure7

Figure7 - click for larger image

Assuming we are on the cusp of a downward trend in solar activity that began circa 1990 according to Javariah, and will decline, say, to a level comparable to the trough seen in the early 1900’s, will it be a sharp decline, like that seen at the beginning of the 19th Century, or a more moderate decline like that seen at the beginning of the 20th Century? A naïve extrapolation might be to replicate the more gradual decline seen during the latter half of the 19th Century, suggesting a gradual decline in solar activity through solar cycle 31, i.e. for most of the 21st Century. And based on the prospect of a phase shift in the pattern of decadal and bidecadal warming rate cycles, the bidecadal cycle would come to be dominated by the influence of the lunar nodal cycle, and the influence of the solar cycle would be diminished, leading at least to a reduction in the rate of global warming, if not an era of global cooling.


This is a prospect worthy of more investigation.


Finally, while we readily concede that multidecadal projections are at best little more than gross speculation, in Figure 6 we have carried the sinusoidal model fit out to 2030, and in Figure 8 we use the sinusoidal model of rate changes to project temperature

Figure 8 - click for larger image

Figure 8 - click for larger image

anomalies through 2030. Assuming a simple projection of the sinusoidal model of rate changes persists through 2030, there would be little or no significant change in global temperature anomalies for the next two decades.


Looking carefully at the sinusoidal model, what we are seeing projected for 2010-2020 are a return to conditions similar to what the model shows for circa 1850-1860, with the period 1853-2020 representing a complete composite cycle of the four combined periods of oscillation. That is, 1853 is the first point at which the sinusoidal model is crossing the x-axis, and at 2020 the model again crossing the x-axis and beginning to repeat a ~167 year cycle. In terms of solar cycle history, that corresponds to a return to conditions similar to solar cycles 10-15, with another phase shift reversing the phase shift of ~1920. If these broad, long term secular swings in solar activity and global atmospheric conditions and temperature anomalies are not random, but reflect solar-terrestrial dynamics that play out over multidecadal and even centennial time-scales, then the early 21st Century may yield a respite from the global warming of the late 20th Century.


Conclusion

There is substantial and statistically significant evidence for decadal and bidecadal oscillations in globally averaged temperature trends. Sinusoidal model analysis of the first differences of the HP smoothed HadCRUT3 time series reveals strong periodicities at 248.2 and 110.7 months, periodicities confirmed as well with MTM spectrum analysis.


Analyzing these periodicities in the time domain with the first differences of the HP smoothed HadCRUT3 time series reveals a pattern of correlation between strong warming rate cycles and the double sunspot cycle for the past four double sunspot cycles. Prior to that, with a phase shift circa 1920, the strong warming rate cycles were dominated by the timing of the lunar nodal cycle.


We suggest that this reversal may be related to a weaker epoch of solar activity prior to 1920, and that we may on the cusp of another phase shift associated with a resumption of such weakened solar activity.


If so, this may result in a reduction in the rate of global warming, and possibly a period of global cooling, further complicating the effort to attribute recent global warming to anthropogenic sources.

sponsored links


Dewa Project Dewa Project Dewa Project