sponsored links


Showing posts with label melting ice. Show all posts

Friday, September 11, 2009

Deadliest Effects of Global Warming…(Knowledge)

Green house gases can stay in the atmosphere for an amount of years ranging from decades to hundreds and thousands of years. No matter what we do, global warming is going to have some effect on Earth. Here are the 5 deadliest effects of global warming.


1. Polar ice caps melting
The ice caps melting is a four-pronged danger.


First, it will raise sea levels. There are 5,773,000 cubic miles of water in ice caps, glaciers, and permanent snow. According to the National Snow and Ice Data Center, if all glaciers melted today the seas would rise about 230 feet. Luckily, that’s not going to happen all in one go! But sea levels will rise.


Second, melting ice caps will throw the global ecosystem out of balance. The ice caps are fresh water, and when they melt they will desalinate the ocean, or in plain English – make it less salty. The desalinization of the gulf current will “screw up” ocean currents, which regulate temperatures. The stream shutdown or irregularity would cool the area around north-east America and Western Europe. Luckily, that will slow some of the other effects of global warming in that area!


Third, temperature rises and changing landscapes in the artic circle will endanger several species of animals. Only the most adaptable will survive.


Fourth, global warming could snowball with the ice caps gone. Ice caps are white, and reflect sunlight, much of which is relected back into space, further cooling Earth. If the ice caps melt, the only reflector is the ocean. Darker colors absorb sunlight, further warming the Earth.

4

2. Economic consequences
Most of the effects of anthropogenic global warming won’t be good. And these effects spell one thing for the countries of the world: economic consequences. Hurricanes cause do billions of dollars in damage, diseases cost money to treat and control and conflicts exacerbate all of these.


3. Increased probability and intensity of droughts and heat waves
Although some areas of Earth will become wetter due to global warming, other areas will suffer serious droughts and heat waves. Africa will receive the worst of it, with more severe droughts also expected in Europe. Water is already a dangerously rare commodity in Africa, and according to the Intergovernmental Panel on Climate Change, global warming will exacerbate the conditions and could lead to conflicts and war.

3

4. Warmer waters and more hurricanes
As the temperature of oceans rises, so will the probability of more frequent and stronger hurricanes. We saw in this in 2004 and 2005.

2

5. Spread of disease
As northern countries warm, disease carrying insects migrate north, bringing plague and disease with them. Indeed some scientists believe that in some countries

1

Tuesday, September 8, 2009

Global warming to trigger “earthquakes, tsunamis, avalanches and volcanic eruptions.”

You can’t make this stuff up. It’s worse than we thought. Related: Why the Greenland and Antarctic Ice Sheets are Not Collapsing

How a Tsunami really gets started - From HowStuffWorks.com - click

How a Tsunami is triggered - From HowStuffWorks.com - click


Climate change: melting ice will trigger wave of natural disasters


Scientists at a London conference next week will warn of earthquakes, avalanches and volcanic eruptions as the atmosphere heats up and geology is altered. Even Britain could face being struck by tsunamis


Robin McKie The Observer, Sunday 6 September 2009


Scientists are to outline dramatic evidence that global warming threatens the planet in a new and unexpected way – by triggering earthquakes, tsunamis, avalanches and volcanic eruptions.


Reports by international groups of researchers – to be presented at a London conference next week – will show that climate change, caused by rising outputs of carbon dioxide from vehicles, factories and power stations, will not only affect the atmosphere and the sea but will alter the geology of the Earth.


Melting glaciers will set off avalanches, floods and mud flows in the Alps and other mountain ranges; torrential rainfall in the UK is likely to cause widespread erosion; while disappearing Greenland and Antarctic ice sheets threaten to let loose underwater landslides, triggering tsunamis that could even strike the seas around Britain.


At the same time the disappearance of ice caps will change the pressures acting on the Earth’s crust and set off volcanic eruptions across the globe. Life on Earth faces a warm future – and a fiery one.


“Not only are the oceans and atmosphere conspiring against us, bringing baking temperatures, more powerful storms and floods, but the crust beneath our feet seems likely to join in too,” said Professor Bill McGuire, director of the Benfield Hazard Research Centre, at University College London (UCL).


“Maybe the Earth is trying to tell us something,” added McGuire, who is one of the organisers of UCL’s Climate Forcing of Geological Hazards conference, which will open on 15 September. Some of the key evidence to be presented at the conference will come from studies of past volcanic activity. These indicate that when ice sheets disappear the number of eruptions increases, said Professor David Pyle, of Oxford University’s earth sciences department.


“The last ice age came to an end between 12,000 to 15,000 years ago and the ice sheets that once covered central Europe shrank dramatically,” added Pyle. “The impact on the continent’s geology can by measured by the jump in volcanic activity that occurred at this time.”


Read the rest here at the Guardian

Friday, June 5, 2009

Geothermal Ice Circles in Russia’s Lake Baikal?

In the “Steig et al – falsified” thread, since we have been discussing geothermal activity along the Antarctic peninsula, I thought I’d pass along these images that show other parts of the planet where geothermal heat seems capable of melting ice and making it all the way to the surface. Lake Baikal is quite deep, over 5000′ feet in places, so this demonstrates that even in deep water, the melting of ice from that geothermal heat is a real possibility. Hat tip to WUWT commenter “Mark” – Anthony


By Betsy Mason, Wired News

baikal1

Click for a larger image - photo from NASA - ISS


Astronauts aboard the International Space Station noticed two mysterious dark circles in the ice of Russia’s Lake Baikal in April. Though the cause is more likely aqueous than alien, some aspects of the odd blemishes defy explanation.


The two circles are the focal points for ice break-up and may be caused by upwelling of warmer water in the lake. The dark color of the circles is due to thinning of the ice, which usually hangs around into June.


Upwelling wouldn’t be strange in some relatively shallow areas of the lake where hydrothermal activity has been detected, such as where the circle near the center of the lake (pictured below) is located.


Circles have been seen in that area before in 1985 and 1994, though they weren’t nearly as pronounced. But the location of the circle near the southern tip of the lake (pictured above) where water is relatively deep and cold is puzzling.


The lake itself is an oddity. It is the largest by volume and the deepest (5370 feet at its deepest point), as well as one of the oldest at around 25 million years. The photo above was taken by an astronaut from the ISS.


The photo below was taken by NASA’s MODIS satellite imager.

baikal3

Click for a larger image - photo from NASA - MODIS

Thursday, May 28, 2009

Burning Ice in Alaska?

I found this video segment from ABC News. A reporter begins the segment on the edge of the Bering Sea, which is located off the west coast of Alaska. The reporter then travels outside of Nome, Alaska and on to the frozen tundra, where he interviews one of the locals. According to the local man, the area experienced a stormier winter compared to normal.


According to the video, Alaska used to be a warm, tropical location millions of years ago, during periods of high atmospheric greenhouse gas concentration. Actually, much higher than what it is today.


The story then focuses on the potential carbon time bomb in Alaska, and that is the natural stores of CO2 and methane gas that were trapped millions of years ago in the permafrost. The permafrost is starting to melt and some scientists are worried that man's continued contribution of greenhouse gases to the atmosphere could cause the release of massive amounts of this CO2 and methane back into the atmosphere, leading to an abrupt and irreversible warming of the planet.


Oh yea, what about that burning ice? Just check out the video, and you will see what I mean.


You can watch the short video segment right here.

Sunday, March 8, 2009

Lake Superior is freezing over

Lake Superior last froze over in 2003. It has now, again, frozen over. The frequency of freeze overs has historically been around once every 20 years. Now, in the last decade, we have seen two freeze overs.


The picture below is a beautiful satellite photo of Lake Superior from yesterday. With the well below freezing temperatures seen over the region Thursday night (-20 F), any isolated open water could have frozen.

Lake Superior satellite image

The NWS in Marquette MI writes:


Due to the recent cold spell and below normal temperatures for much of the winter of 2008-2009, ice covers nearly all of Lake Superior. Only small areas of open water remain. This image was taken on Tuesday, March 3rd. If arctic air does not return in the next couple of weeks, it is likely that this will be the day of maximum ice cover on Lake Superior for this winter as warmer weather and periods of stronger winds through the end of this week will cause open water areas to expand. Click on the image to view a higher resolution satellite picture (image is large — just under 1mb).


Source:
http://www.crh.noaa.gov/mqt/?n=lake_superior_ice

Friday, March 6, 2009

Northern Fringes of Ice Sheet Experienced Extreme Melting

The northern fringes of Greenland's ice sheet experienced much higher the normal melting during 2008, according to NASA researchers.


The image below shows the number of days when melting occurred on the ice sheet compared to the average number of melt days (anomaly) between 1979 and 2007. The blues indicate less melt days compared to normal in 2008, while the reds indicate a higher number of melt days compared to normal.

Other highlights from the research..........


--Many locations in northern Greenland experienced a record number of melt days.


--Average temperatures across northern Greenland were as much as 3 degrees C above average between June and August of 2008.


--Nearby ground based observations were unusually high and new records were set at many stations.

--------

The above image was made with data from the Special Sensor Microwave Imager (SSM/I) on board the F13 satellite of the U.S. Defense Meteorological Satellite Program (DMSP).
Here is the link to the Earth Observatory story.

Sunday, February 22, 2009

Sea Ice Sensor Degradation Hits Cryosphere Today

You may recall that I posted about how the National Snow and Ice Data Center has an issue with the DMSP satellite sensor channel used to detect sea ice. Cryosphere Today is a few days behind in update compared to NSIDC, and here is what their imagery now looks like before and after:

cryosphere2day_021909-022009-small

Above: Arctic “Insta-melt” Click for a larger image


Here is the link to reproduce the image above.


Larger “holes” are likely to open up in the arctic sea in the next couple of days as the sensor further degrades.


Here is what CT has to say as a caveat for the side by side images:

February 17, 2009 - The SSMI sensor seems to be acting up and dropping data swaths from time to time in recent days. Missing swaths will appear on these images as a missing data in the southern latitudes. If this persists for more than a few weeks, we will start to fill in these missing data swaths with the ice concentration from the previous day. Note - these missing swaths do not affect the timeseries or any other plots on the Cryosphere Today as they are comprised of moving averages of at least three days.

No mention of the issue on CT’s main page though. They are still commenting on George Will. They seem a bit out of touch on the sensor issue.


Possibly related posts: (automatically generated)

Wednesday, February 4, 2009

Arctic Sea Ice Increases at Record Rate

Guest Post by Jeff Id on February 3, 2009

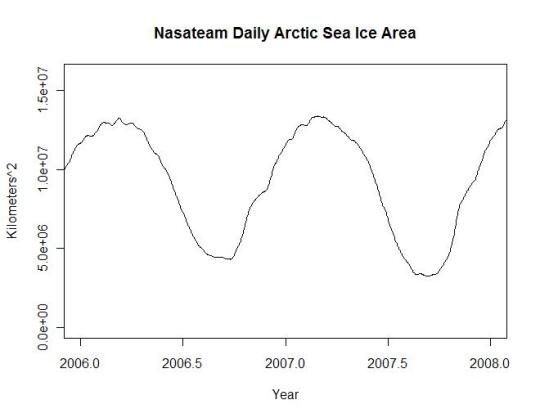
Something I’ve been interested in for the last several months is sea ice data. What makes it interesting is that as I understand it, models demonstrate the poles should be most sensitive to global warming leading the planet temp, especially in the Arctic. Recently I have been able to process the monthly and daily gridded arctic data as provided by NSIDC. The daily values allow a better analysis of trend than can be provided by the monthly data.


If you’re like me you recall the claims of fastest melt rate ever were made about 2007 , I fully believed them, because the graphs showed a much more negative value than in the previous 30 years as shown in Figure 1 below.

06-07-ice-area1

Click for larger image


This effort was originally intended to investigate how bad the melt rate was in comparison to the natural variation, I didn’t get that far yet. Accessing and processing the gridded data was critical to the analysis, so I spent the time reading the literature and writing code. Having full access to the NSIDC data allows some interesting analysis, they do an excellent job on their site.


There are two primary algorithms used for processing ice data NasaTeam and Bootstrap. The descriptions of the data state the difference between the two is very small and the sets are interchangeable except that bootstrap is recommended for trend analysis in research publications. Bootstrap is only provided in monthly data format while NasaTeam is provided in both monthly and daily provided you’re willing to download over 1G of data, write code to process it, refit the land and missing data mask and sum the results. I am. Also, NasaTeam provides a near real time version of the polar ice data which has a different land mask and hasn’t been processed for missing data. This data isn’t as clean but I wanted to use it. I applied the same land mask as the rest of the series to insure that there was a consistent baseline for trend analysis. The missing data from Jan 2008 onward created noise in the series which I simply filtered out using a 7 day sliding window filter.


The mask looks like this Figure 2

nasateam-arctic-ice-mask


The brown is land, black edges on land are coastline and light blue is the satellite data not measured. This mask is applied consistently through the entire data series. There was some question about masking on one of my other posts at WUWT where visually the land area seemed to change size, in the case of the NSIDC data they apply masks consistently except for the satellite hole and the near real time data.


The NasaTeam version of the arctic ice data looks like the plot below for 2009 (note the small size of the satellite data hole). This graph was created in R using the actual Nasa Team masks and data. I used the worst case land and polar masks to adjust the entire dataset to eliminate problems with consistency. Figure 3

nasateam-arctic-ice-feb-2009


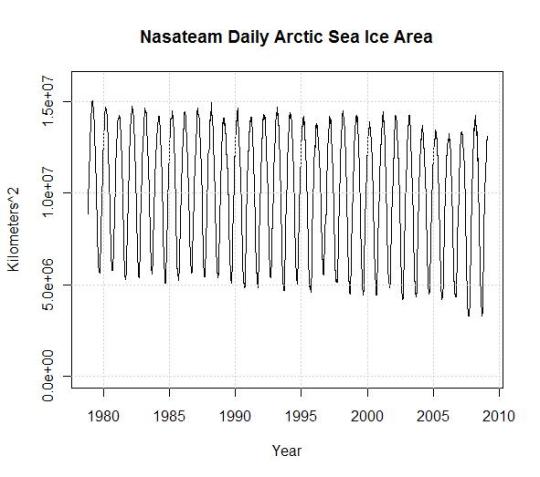
Of course it’s an interesting picture, but what I wanted to know when I started this post was how bad was the worst melt rate in history and what is the actual melt area. In the plot below the arctic is losing sea ice at a rate of only 56K km^2/year. Of course sea ice area went up in the Antarctic during the same time frame though. Note the strong recovery in 08 of Figures 1 and 4, which actually exceeds values of most of the record, matching data back to 1980. Much of this is first year ice so the melt in 08 was expected to be a new record.

30-yr-ice-area1

Click for larger image


If you recall, in 2007 and 08 we were treated to headlines like this, which most of us accepted with a shrug.

Scientists warn Arctic sea ice is melting at its fastest rate since records began


NASA data show Arctic saw fastest sea ice melt in August 2008


Arctic Just Witnessed Fastest August Ice Retreat in History


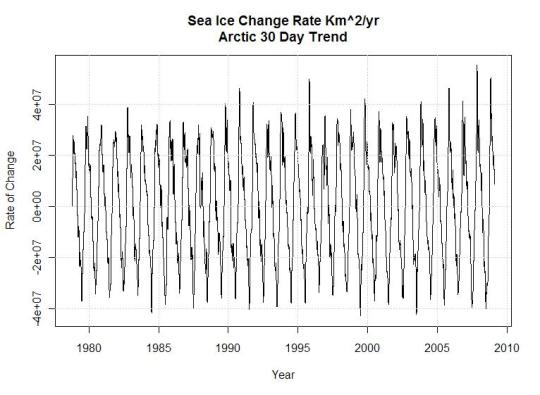
I processed and analyzed the NasaTeam land area and missing data masks spending hours understanding different variances they list on their own website. After nearly everything I could find (except satellite transitions errors) was corrected (a different post) and corrections for variance in the measured pixel size, the final result in 30 day trends of arctic sea ice looks like the graph below (Figure 5). This graph is a derivative of the ice area plot. The maximum peaks and valleys represent the maximum rates of change in 30 day periods through the ice record.

meltrate

Click for larger image


Looking at this plot of the 30 day slopes of actual NASA gridded data, the maximum ice melt rate occurs in 1999 and in 2004 not in 2007. Surprisingly the maximum ice growth rates occur in 2007 and 2008, I don’t remember those headlines for some reason. Don’t forget when looking at the 2008 - 09 peak, the data is preliminary and hasn’t been through the same processing as the other data. From looking at the unprocessed data I doubt it will change much.


Certainly the 30 year arctic trend in ice area is downward, even the most committed global warming scientist has to admit this happens regularly in climate along with regular 30 year uptrends. The questions are, did we cause it or not, and was CO2 the instigating factor. The rapid recovery of ice levels has to have some meaning regarding the severity of the problem. This goes directly in the face of accelerated global warming and the doom and gloom scenarios promoted by our politicians and polyscienticians.


Why are my conclusions different from the news reported records? I think it’s likely due to the fact that the scientists used the monthly data which is processed using a weighted filter of the daily data that incorporates a longer time frame than a single month. This means their use of the monthly data to establish a monthly trend was in error and the real record down trends were actually set in 1999, 2003 and 1984. While the record uptrends were in 2007, 2008 and 1996.

Tuesday, January 13, 2009

Greenland Glaciers may be Stabilizing after Rapid Retreat

Greenland Glaciers.


So far this century, the glaciers of Greenland have been shrinking at a rapid pace, but according to a new study from Durham University in England this rapid decrease may stall out despite atmospheric warming, thus diminishing Greenland's contribution to rising sea levels due to global warming.


"Our modeling suggests that these very high rates of glacier retreat can’t be maintained for very long," said Andreas Vieli, a co-author of the paper, according to the Bloomberg.com article.


Studies at one particular glacier (Helheim) in Greenland indicated that the main driver of the melting was a break at the glacier's snout in the sea that had a domino effect inland. But, the researchers found that the glaciers stabilize after an initial rapid retreat.


The Helheim glacier retreated 7 kilometers between 2003 and 2005, but has since advanced 4 kilometers.


Images showing the retreat of the Helheim Glacier from 2001-2005.


This latest study will help scientists to tune existing computer models for ice sheets to predict future melting, Vieli said.


thanks global-warming.accuweather

Global warming will be a killer for agriculture, UW scientists say

Forget ice melting and sea-level rise. Global warming's most pressing threat may be heat that wilts crops across much of the globe, says a UW scientist.

When searing heat waves blasted Western Europe in 2003, more than 50,000 people perished and harvests of corn, wheat and fruit fell by up to a third.

Imagine those temperatures being the norm over much of the world, and you'll have an idea of what the future is likely to hold for agriculture — and humanity, says a new report from scientists at the University of Washington and Stanford University.

"I'm not worried about Greenland sliding into the sea. I'm not worried about sea levels going up," said UW atmospheric-sciences professor David Battisti. Those changes will take several hundred years to unfold, he said, but the effects on agriculture will begin showing up within the next several decades.

"This is probably the most compelling reason why we need to deal with global warming."

If the buildup of greenhouse-gas emissions isn't halted or slowed, the odds are higher than 90 percent that average growing-season temperatures will be higher than in recorded history across a big swath of the planet by the end of the century, says the analysis published today in the journal Science. The hardest-hit areas will be the tropics and subtropics, which encompass about half the world's population and include Africa, the southern United States, and much of India, China and South America.

"We are headed for a completely out-of-bounds situation for growing food crops in the future," said report co-author Rosamond Naylor, director of Stanford's Program on Food Security and the Environment.

There is time to adapt to the rising temperatures through development of heat-resistant crops, the scientists say.

High temperatures cause plants like rice, corn and wheat to grow faster but reduce plant fertility and grain production. With average growing-season temperatures expected to rise more than 6 degrees F in many places, crop yields will fall 20 to 40 percent, the report estimates. The effects will be aggravated by increased evaporation and loss of soil moisture.

Even in the United States, where warming caused by greenhouse-gas emissions is projected to increase some crop yields through the middle of this century, harvests will most likely fall by 2100 as the heat intensifies.

But worldwide, the impacts will be felt most keenly by subsistence farmers and the poor, Battisti pointed out.

"You're talking about hundreds of millions of additional people looking for food because they won't be able to find it where they find it now."

France and Italy were able to turn to other nations to fill their food gaps in 2003, but a 1972 drought in the former Soviet Union showed how easily worldwide grain supplies can be disrupted, the report says. After the Soviets secretly began buying vast amounts of wheat, global prices more than tripled.

In a warmer future, there will be fewer places to turn for help when the cupboards are bare, Battisti said. "In a sense, there will be no place to hide from this."

The scientists reached their conclusions by combining climate data with projections from 23 global climate models used by the Intergovernment Panel on Climate Change, winner of the 2007 Nobel Peace Prize.

Michael Glantz, a political scientist who studies the social impacts of climate and climate change, said the study raises some good points, but that the developing world faces so many immediate problems it's difficult to worry about what will happen in five decades or more.

"When I think about 2100 and climate-change impact on food security, I just glaze over," said Glantz, who directs the Consortium for Capacity Building at the University of Colorado, Boulder.

But Cary Fowler, director of the Rome-based Global Crop Diversity Trust, says the report is a wake-up call for the need to develop new heat-resistant crop strains.

"This research shows we're about to enter a whole new game," said Fowler, whose group receives funding from the Bill & Melinda Gates Foundation and operates the "doomsday" seed vault on the remote Norwegian island of Spitsbergen.

It can take two decades or more to breed a new crop strain, but investments in agricultural research have been stagnant for the past several decades, Naylor pointed out.

The Gates Foundation is helping fund an effort in Africa to develop hardier crop strains. That work hasn't focused specifically on heat tolerance, said Gary Toenniessen, of the Rockefeller Foundation, a partner in the project. But it is helping developing agricultural-research capacity where it will be needed most in the future.

Spurred partly by Battisti's work, the Global Crop Diversity Trust has launched a program to screen existing seed collections for traits like heat and drought resistance, Fowler said. It's also developing a computerized database to share the information.

"Plants can be adapted to a range of temperatures," Fowler said. "This really is a problem that we can solve."

Sunday, January 11, 2009

Polar Sea Ice Changes are Having a Net Cooling Effect on the Climate


A guest post by Steven Goddard

One of the most widely discussed climate feedbacks is the albedo effect of polar sea ice loss. Ice has a relatively high albedo (reflectance) so a reduction in polar ice area has the effect of causing more shortwave radiation (sunlight) to be absorbed by the oceans, warming the water. Likewise, an increase in polar sea ice area causes more sunlight to be reflected, decreasing the warming of the ocean. The earths radiative balance is shown in the image below. It is believed that about 30% of the sunlight reaching the earth’s atmosphere is directly reflected - 20% by clouds, 6% by other components of the atmosphere, and 4% by the earth’s surface.

Radiation & Climate Slide
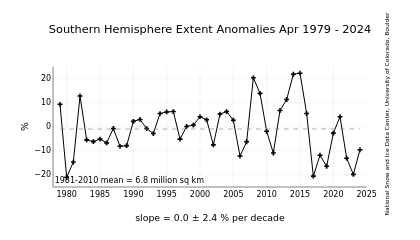
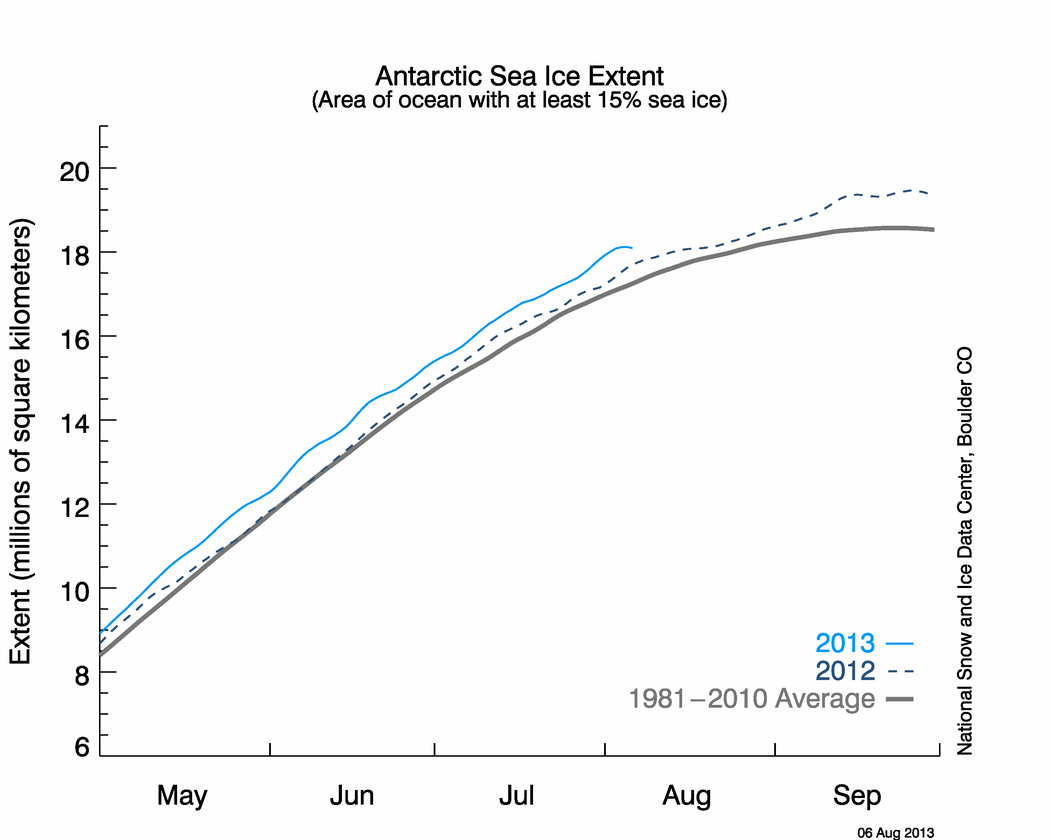
We all have heard many times that summer sea ice minimums have declined in the northern hemisphere over the last 30 years. As mentioned above, this causes more sunlight to reach the dark ocean water, and results in a warming of the water. What is not so widely discussed is that southern hemisphere sea ice has been increasing, causing a net cooling effect. This article explains why the cooling effect of excess Antarctic ice is significantly greater than the warming effect of missing Arctic ice.
Over the last 30 years Antarctic sea ice has been steadily increasing, as shown below.

http://nsidc.org/data/seaice_index/images/s_plot.png

December is the month when the Antarctic sun is highest in the sky, and when the most sunlight reaches the surface. Thus an excess of ice in December has the maximum impact on the southern hemisphere’s radiative balance. In the Antarctic, the most important months are mid-October through mid-February, because those are months when the sun is closest to the zenith. The rest of the year there is almost no shortwave radiation to reflect, so the excess ice has little effect on the shortwave radiative (SW) balance.

This has been discussed in detail by Roger Pielke Sr. and others in several papers.
http://www.climatesci.org/publications/pdf/R-222.pdf
http://www.climatesci.org/publications/pdf/R-256.pdf

So how does this work? Below are the details of this article’s thesis.

1. As mentioned above, the Antarctic ice excess occurs near the December solstice when the sun is highest above the horizon. By contrast, the Arctic ice deficiency appears near the equinox - when the sun is low above the horizon. Note in the graph below, that Arctic ice reaches it’s minimum in mid-September - just when the sun is setting for the winter at the North Pole. While the September, 2008 ice minimum maps were dramatic, what they did not show is that there was little sunlight reaching the water that time of year. The deviation from normal did not begin in earnest until mid-August, so there were only a couple of weeks where the northern hemisphere SW radiative balance was significantly impacted. Thus the water in most of the ice-deficient areas did not warm significantly, allowing for the fast freeze-up we saw during the autumn.
The 2008 peak Arctic ice anomaly occurred near the equinox, when it had the minimum heating effect on the ocean.
http://www.ijis.iarc.uaf.edu/seaice/extent/AMSRE_Sea_Ice_Extent.png
By contrast, the peak Antarctic ice anomaly occurred at the December solstice, when it had a maximum cooling effect, as shown below.
http://nsidc.org/data/seaice_index/images/daily_images/S_timeseries.png
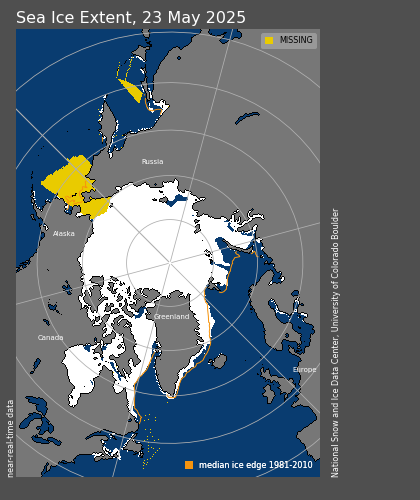
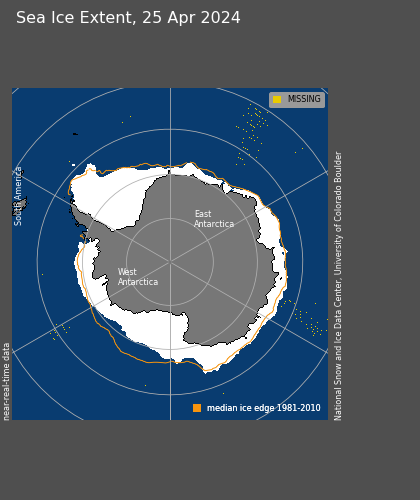
2. The next factor to consider is the latitude of the ice, which has a strong effect on the amount of solar insolation received. Arctic sea ice is closer to the pole than Antarctic sea ice. This is because of the geography of the two regions, and can be seen in the NSIDC images below.

http://nsidc.org/data/seaice_index/images/daily_images/N_daily_extent.png
http://nsidc.org/data/seaice_index/images/daily_images/S_daily_extent.png

Antarctic sea ice forms at latitudes of about 55-75 degrees, whereas most Arctic ice forms closer to the pole at latitudes of 70-90 degrees. Because Antarctic ice is closer to the tropics than Arctic ice, and the sun there reaches a higher angle above the horizon, Antarctic sea ice receives significantly more solar radiation in summer than Arctic sea ice does in its’ summer. Thus the presence or absence of Antarctic ice has a larger impact on the SW radiative balance than does the presence or absence of Arctic ice.

At a latitude of -65 degrees, the sun is about 40 degrees below the zenith on the day of the solstice. Compare that to early September negative anomaly peak in the Arctic at a latitude of 80 degrees, when the sun is more than 70 degrees below the zenith. The amount of solar radiation hitting the ice surface at those maxima is approximately 2.2 times greater in the the Antarctic than it is in the Arctic = cos(70) / cos(40) .

The point being again, that due to the latitude and date, areas of excess Antarctic ice reflect a lot of SW radiation back out into space, whereas deficient Arctic ice areas allow a much smaller quantity of SW radiation to reach the dark surface of water. Furthermore, in September the angle of incidence of the sun above the water is below the critical angle, so little sunlight penetrates the surface, further compounding the effect. Thus the Antarctic positive anomaly has a significantly larger effect on the earth’s SW balance than does the Arctic negative anomaly.

3. The next point is an extension of 2. By definition, excess ice is further from the pole than missing ice. Thus a 10% positive anomaly has more impact on the earth’s SW balance than does a 10% negative anomaly.

4. Due to eccentricity of the earth’s orbit, the earth is 3% closer to the sun near the December solstice, than it is during the June solstice. This further compounds the importance of Antarctic ice excess relative to Arctic ice deficiency.

All of these points work together to support the idea that so far, polar ice albedo feedback has been opposite of what the models have predicted. To date, the effect of polar albedo change has most likely been negative, whereas all the models predicted it to be positive. There appears to be a tendency in the climate community to discount the importance of the Antarctic sea ice increase, and this may not be appropriate.

thanks to wattsupwiththat

Sunday, January 4, 2009

Amazing discovery of green algae which could save the world from global warming

Melting icebergs, so long the iconic image of global warming, are triggering a natural process that could delay or even end climate change, British scientists have found.

A team working on board the Royal Navy’s HMS Endurance off the coast of Antarctica have discovered tiny particles of iron are released into the sea as the ice melts.

The iron feeds algae, which blooms and sucks up damaging carbon dioxide (CO2), then sinks, locking away the harmful greenhouse gas for hundreds of years.

British scientists have discovered that green algae could bury CO2 omissions at the bottom of the ocean

The team think the process could hold the key to staving off globally rising temperatures.

Lead researcher Professor Rob Raiswell, from Leeds University, said: ‘The Earth itself seems to want to save us.’

As a result of the findings, a ground-breaking experiment will be held this month off the British island of South Georgia, 800 miles south east of the Falklands. It will see if the phenomenon could be harnessed to contain rising carbon emissions.

Researchers will use several tons of iron sulphate to create an artificial bloom of algae. The patch will be so large it will be visible from space.

Scientists already knew that releasing iron into the sea stimulates the growth of algae. But environmentalists had warned that to do so artificially might damage the planet’s fragile ecosystem.

Last year, the UN banned iron fertilisation in the Great Southern Ocean.

The team working on board HMS Endurance off the coast of Antartica have discovered tiny particles of iron are released into the sea as ice melts

However, the new findings show the mechanism has actually been operating naturally for millions of years within the isolated southern waters. And it has led to the researchers being granted permission by the UN to move ahead with the experiment.

The scientist who will lead the next stage of the study, Professor Victor Smetacek, said: ‘The gas is sure to be out of the Earth’s atmosphere for several hundred years.’

The aim is to discover whether artificially fertilising the area will create more algae in the Great Southern Ocean. That ocean is an untapped resource for soaking up CO2 because it doesn’t have much iron, unlike other seas.

It covers 20million square miles, and scientists say that if this could all be treated with iron, the resulting algae would remove three-and-a-half gigatons of carbon dioxide. This is equivalent to one eighth of all emissions annually created by burning fossil fuels such as oil, gas and coal.

It would also be equal to removing all carbon dioxide emitted from every power plant, chimney and car exhaust in the rapidly expanding industries of India and Japan.

However, the experts warn it is too early to say whether it will work.

The team from ice patrol ship HMS Endurance used sledgehammers to chip deep into the interior of a 33ft-long mass of polar ice from half-a-dozen house-sized icebergs that had blown ashore in Antarctica.

Once back in the UK, they used a special microscope to analyse the samples, which revealed what they had been looking for – tiny iron particles, only a few millionths of a millimetre wide, embedded deep within the ice. Until now, it was thought that the only source of iron in the Southern Ocean was wind blowing in metal compounds from the deserts of nearby continents like Australia. But the research has disproved this.

Lead researcher Prof Rob Raiswell thinks the process could hold the key to staving off globally rising temperatures

Prof Raiswell said: ‘These particles measure only a fraction of a millimetre, but they have great importance for the global climate.’

Rising global temperatures, particularly over the past 50 years, have increased the rate at which polar ice melts, causing sea levels to rise.

Ten of the warmest years on record have been since 1991, with experts predicting that 2009 could be the hottest year yet.

The climate-change effect is set to substantially increase over the coming decades, as developing industrial nations pump out more CO2. Temperatures along the Antarctic Peninsula alone have increased by 2.5C over the past 50 years.

But for every percentage point increase in the amount of ice that breaks off, Prof Raiswell calculates that a further 26million tons of CO2 is removed from the atmosphere.

Polar expert Professor Smetacek and a 49-strong German research team is due to set sail from Cape Town in the icebreaker Polarstern in the next few days to conduct their groundbreaking experiment.

Crucially, the scientists want to know how much algae will sink to the bottom of the ocean where the CO2 will be safely trapped.

Rob Raiswell a geochemist at the University of Leeds believes the project is controversial as they are unsure of the effects on the ecosystem

Algae that falls a couple of miles below the surface will remain there for hundreds of years; algae that remains only a few hundred metres from the surface releases carbon back into the atmosphere.

Dr Phil Williamson, scientific co-ordinator of the Surface Ocean Lower Atmosphere study, funded by the UK’s National Environment Research Council, called the research ‘exciting’.

‘We have images from satellites which show the ocean stays green for weeks afterwards but the
key will be whether it stays that way,’ said Dr Williamson.

Schemes to fertilise the seas with iron have in the past been driven by commercial interests. This is the biggest ever scientific attempt.

Last May, the UN Convention on Biological Diversity called a halt to fertilisation around the Antarctic until there was more detailed scientific data. But the British findings led to the go-ahead for Professor Smetacek’s team from the Alfred Wegener Institute for Polar and Marine Research in Bremerhaven, Germany.

Nonetheless, even Prof Raiswell has called the project ‘highly controversial’. He said: ‘Oceans aren’t isolated boxes and it would affect the surrounding areas as well.

‘We don’t know what effect that would have. The ecosystems are very complicated. If the iceberg iron is useful, then it will just buy us more time.

‘The Earth might have fightback mechanisms but we must still try to reduce our CO2 emissions.’

Prof Smetacek said the issue is too complex not to be explored by scientists. He warned: ‘Objections will be swept away when our powerlessness in the face of climate change becomes apparent.’

Tuesday, December 23, 2008

Did Early Global Warming Divert A New Glacial Age?

ScienceDaily (Dec. 18, 2008) — The common wisdom is that the invention of the steam engine and the advent of the coal-fueled industrial age marked the beginning of human influence on global climate.

But gathering physical evidence, backed by powerful simulations on the world's most advanced computer climate models, is reshaping that view and lending strong support to the radical idea that human-induced climate change began not 200 years ago, but thousands of years ago with the onset of large-scale agriculture in Asia and extensive deforestation in Europe.

Glacier and mountain peaks in East Greenland. Using three different climate models and removing the amount of greenhouse gases humans have injected into the atmosphere during the past 5,000 to 8,000 years, scientists observed more permanent snow and ice cover in regions of Canada, Siberia, Greenland and the Rocky Mountains, all known to be seed regions for glaciers from previous ice ages. (Credit: iStockphoto/Rob Broek)

What's more, according to the same computer simulations, the cumulative effect of thousands of years of human influence on climate is preventing the world from entering a new glacial age, altering a clockwork rhythm of periodic cooling of the planet that extends back more than a million years.

"This challenges the paradigm that things began changing with the Industrial Revolution," says Stephen Vavrus, a climatologist at the University of Wisconsin-Madison's Center for Climatic Research and the Nelson Institute for Environmental Studies. "If you think about even a small rate of increase over a long period of time, it becomes important."

Addressing scientists on Dec 17 at a meeting of the American Geophysical Union, Vavrus and colleagues John Kutzbach and Gwenaëlle Philippon provided detailed evidence in support of a controversial idea first put forward by climatologist William F. Ruddiman of the University of Virginia. That idea, debated for the past several years by climate scientists, holds that the introduction of large-scale rice agriculture in Asia, coupled with extensive deforestation in Europe began to alter world climate by pumping significant amounts of greenhouse gases — methane from terraced rice paddies and carbon dioxide from burning forests — into the atmosphere. In turn, a warmer atmosphere heated the oceans making them much less efficient storehouses of carbon dioxide and reinforcing global warming.

That one-two punch, say Kutzbach and Vavrus, was enough to set human-induced climate change in motion.

"No one disputes the large rate of increase in greenhouse gases with the Industrial Revolution," Kutzbach notes. "The large-scale burning of coal for industry has swamped everything else" in the record.

But looking farther back in time, using climatic archives such as 850,000-year-old ice core records from Antarctica, scientists are teasing out evidence of past greenhouse gases in the form of fossil air trapped in the ice. That ancient air, say Vavrus and Kutzbach, contains the unmistakable signature of increased levels of atmospheric methane and carbon dioxide beginning thousands of years before the industrial age.

"Between 5,000 and 8,000 years ago, both methane and carbon dioxide started an upward trend, unlike during previous interglacial periods," explains Kutzbach. Indeed, Ruddiman has shown that during the latter stages of six previous interglacials, greenhouse gases trended downward, not upward. Thus, the accumulation of greenhouse gases over the past few thousands of years, the Wisconsin-Virginia team argue, is very likely forestalling the onset of a new glacial cycle, such as have occurred at regular 100,000-year intervals during the last million years. Each glacial period has been paced by regular and predictable changes in the orbit of the Earth known as Milankovitch cycles, a mechanism thought to kick start glacial cycles.

"We're at a very favorable state right now for increased glaciation," says Kutzbach. "Nature is favoring it at this time in orbital cycles, and if humans weren't in the picture it would probably be happening today."

Importantly, the new research underscores the key role of greenhouse gases in influencing Earth's climate. Whereas decreasing greenhouse gases in the past helped initiate glaciations, the early agricultural and recent industrial increases in greenhouse gases may be forestalling them, say Kutzbach and Vavrus.

Using three different climate models and removing the amount of greenhouse gases humans have injected into the atmosphere during the past 5,000 to 8,000 years, Vavrus and Kutzbach observed more permanent snow and ice cover in regions of Canada, Siberia, Greenland and the Rocky Mountains, all known to be seed regions for glaciers from previous ice ages. Vavrus notes: "With every feedback we've included, it seems to support the hypothesis (of a forestalled ice age) even more. We keep getting the same answer."

Thursday, December 11, 2008

Melting ice may slow global warming

Scientists discover that minerals found in collapsing ice sheets could feed plankton and cut C02 emissions

Collapsing antarctic ice sheets, which have become potent symbols of global warming, may actually turn out to help in the battle against climate change and soaring carbon emissions.

Professor Rob Raiswell, a geologist at the University of Leeds, says that as the sheets break off the ice covering the continent, floating icebergs are produced that gouge minerals from the bedrock as they make their way to the sea. Raiswell believes that the accumulated frozen mud could breathe life into the icy waters around Antarctica, triggering a large, natural removal of carbon dioxide from the atmosphere.

And as rising temperatures cause the ice sheets to break up faster, creating more icebergs, the amount of carbon dioxide removed will also rise. Raiswell says: ' It won't solve the problem, but it might buy us some time.'

As the icebergs drift northwards, they sprinkle the minerals through the ocean. Among these minerals, Raiswell's research shows, are iron compounds that can fertilise large-scale growth of photosynthetic plankton, which take in carbon dioxide from the air as they flourish.

According to his calculations, melting Antarctic icebergs already deposit up to 120,000 tonnes of this 'bioavailable' iron into the Southern Ocean each year, enough to grow sufficient plankton to remove some 2.6 billion tonnes of carbon dioxide, equivalent to the annual carbon pollution of India and Japan. A 1 per cent increase in the number of icebergs in the Southern Ocean could remove an extra 26 million tonnes of CO2, equivalent to the annual emissions of Croatia.

Raiswell, a Leverhulme Emeritus Fellow, said: 'We see the rapid ice loss in Antarctica as one obvious sign of climate warming, but could it be the Earth's attempt to save us from global warming?' He added that the effect had not been discovered before because scientists assumed that the iron in the iceberg sediment was inert and could not be used by plankton.

In a paper published in the journal Geochemical Transactions, Raiswell and colleagues at the University of Bristol and the University of California describe how they chipped samples off four Antarctic icebergs blown ashore on Seymour island by a storm in the Weddell Sea.

They found that they contained grains of ferrihydrite and schwertmannite, two iron minerals that could boost plankton growth. 'These are the first measurements of potentially bioavailable iron on Antarctic ice-hosted sediments,' they write. 'Identifying icebergs as a significant source of bioavailable iron may shed new light on how the oceans respond to atmospheric warming.'

No rivers flow into the Southern Ocean and the only previously identified major source of iron for its anaemic waters is dust blown from South America. The team says that icebergs could deliver at least as much iron as the dust.

A key question is how much of the carbon soaked up by the growing plankton is returned to the atmosphere. 'We simply don't know the answer to that,' Raiswell said. Seeding the oceans with iron will only benefit the climate if the plankton sink to the bottom when they die, taking the carbon with them.

David Vaughan, a glaciologist with the British Antarctic Survey, said: 'It's a very interesting new line of research and one that should be looked at in more detail.'

He said the number of icebergs in the Antarctic was expected to rise by about 20 per cent by the end of the century, which could remove an extra 500 million tonnes of carbon dioxide each year, if they all seeded plankton growth.

sponsored links


Dewa Project Dewa Project Dewa Project